Confidential client deliverable · Enter the passcode you were given
Imagine Wireless · Powered by OoklaConfidential
CLE · Rev 1 Baseline
Venue Network Intelligence Report · Deep Edition · Rev 1
Network baseline for Cleveland Hopkins International Airport ahead of a neutral-host decision
The reconciled DAS master records no distributed antenna system (DAS), no self-owned
system, and no neutral host at CLE Imagine knowledge graph. A 2024
neutral-host DAS solicitation exists; no award appears in the record we hold. This report measures
where each carrier stands at the gates, by zone, by band, and by serving cell, so a design and an
acceptance plan can start from a documented baseline.
49
Gates measured · every gate-carrier pair n ≥ 30 tiles
Gate-carrier pairs below the critical line (−110 dBm)
Prepared by the Imagine Wireless Network Intelligence Platform · Powered by Ookla
Data window 2025-08-01 to 2026-07-31 · Issued 2026-09-08 (rev 1) · Freshness 39 days at issue
Prepared for City of Cleveland Department of Port Control stakeholder review
Confidential
Section 1
Overview
Executive readout
Verizon leads Concourses A and B and the venue gate median. T-Mobile leads Concourse C on the
tile basis; the Main Terminal is split between T-Mobile's stronger median and Verizon's higher healthy
share. AT&T sits below the healthy line at 39 of 49 gates.
No gate is critical for any carrier: 0 of 147 gate-carrier pairs measure below −110 dBm.
−86.1 dBm
Verizon gate median 5G RSRP · healthy at 49 of 49 gates
−89.1 dBm
T-Mobile gate median 5G RSRP · healthy at 49 of 49 gates
−96.3 dBm
AT&T gate median 5G RSRP · healthy at 10 of 49 gates · at risk at 39
Verizon
Strongest at the gates on the venue median and the LTE network of record. Median 5G
reference signal received power (RSRP) of −86.1 dBm, healthy at 49 of 49 gates, best 5G NR at
34 of 49 gates, and best LTE at 46 of 49. Median signal-to-interference-plus-noise ratio (SINR) is
+16.4 dB, healthy at 49 of 49 gates. Verizon holds best 5G NR at all 13 Concourse A gates and all
11 Concourse B gates.
T-Mobile
Healthy at 49 of 49 gates with a gate median of −89.1 dBm, 3.0 dB behind Verizon.
T-Mobile holds best 5G NR at 15 of the 25 Concourse C gates, leads Concourse C on the tile basis,
and holds the stronger Main Terminal median while Verizon holds the higher healthy share there (section 6). Its 5G footprint is the widest of the three carriers at 87%
of its tiles. Its LTE median at the gates is −97.4 dBm, healthy at 6 of 49 gates.
AT&T
The load-bearing finding of this report. Gate median −96.3 dBm, 1.3 dB below the
−95 dBm healthy line; healthy at 10 of 49 gates, at risk at 39, critical at 0. AT&T is the weakest
carrier at 47 of the 49 asymmetry gates and the weak carrier at all 39 one-carrier-weak gates
(section 5). A 5G reading appears on 36% of its tiles; the other 64% carry LTE only, with an LTE
median of −96.8 dBm at the gates. A hosted AT&T path is the largest measurable lift a neutral-host
system could deliver at CLE.
How to read the margins
The Verizon-to-T-Mobile gate-median margin is 3.0 dB, and both carriers are healthy at every
gate. The material gap is to AT&T: 7.2 dB from T-Mobile and 10.2 dB from Verizon
on the gate median. Margins under 1 dB are reported as ties, never as rankings. Zone-level results
use the tile basis and differ from the gate ranking in Concourse C and the Main Terminal.
What this report measures
Every result is signal-layer: RSRP and SINR from an Android crowdsource panel, aggregated per tile
over the 12-month window. The export contains no throughput, latency, or session counts, so it
shows where signal is, not whether a call or an app fails. A strong-signal network can still
be congested. Section 13 states the thresholds and caveats.
Section 2
Venue and procurement context
Asset inventory · solicitation record
CLE is owned and operated by the City of Cleveland through its Department of Port Control.
The record we hold describes a medium hub with no in-building cellular system and a 2024 neutral-host
solicitation whose current status this report does not hold. Measured facts in this report stand on
the tile export alone; the knowledge graph (KG) record may corroborate them and never originates
them.
Element
Value
Notes
Airport
Cleveland Hopkins International (CLE / KCLE)
City of Cleveland, Department of Port Control · medium hub · 4,855,943 calendar-year enplanements Imagine knowledge graph
Traffic
10,003,833 passengers in 2025, down 1.7%
Per the Imagine knowledge graph
Tile basis
25,152 on-airport RF tiles · 14,065 usage tiles
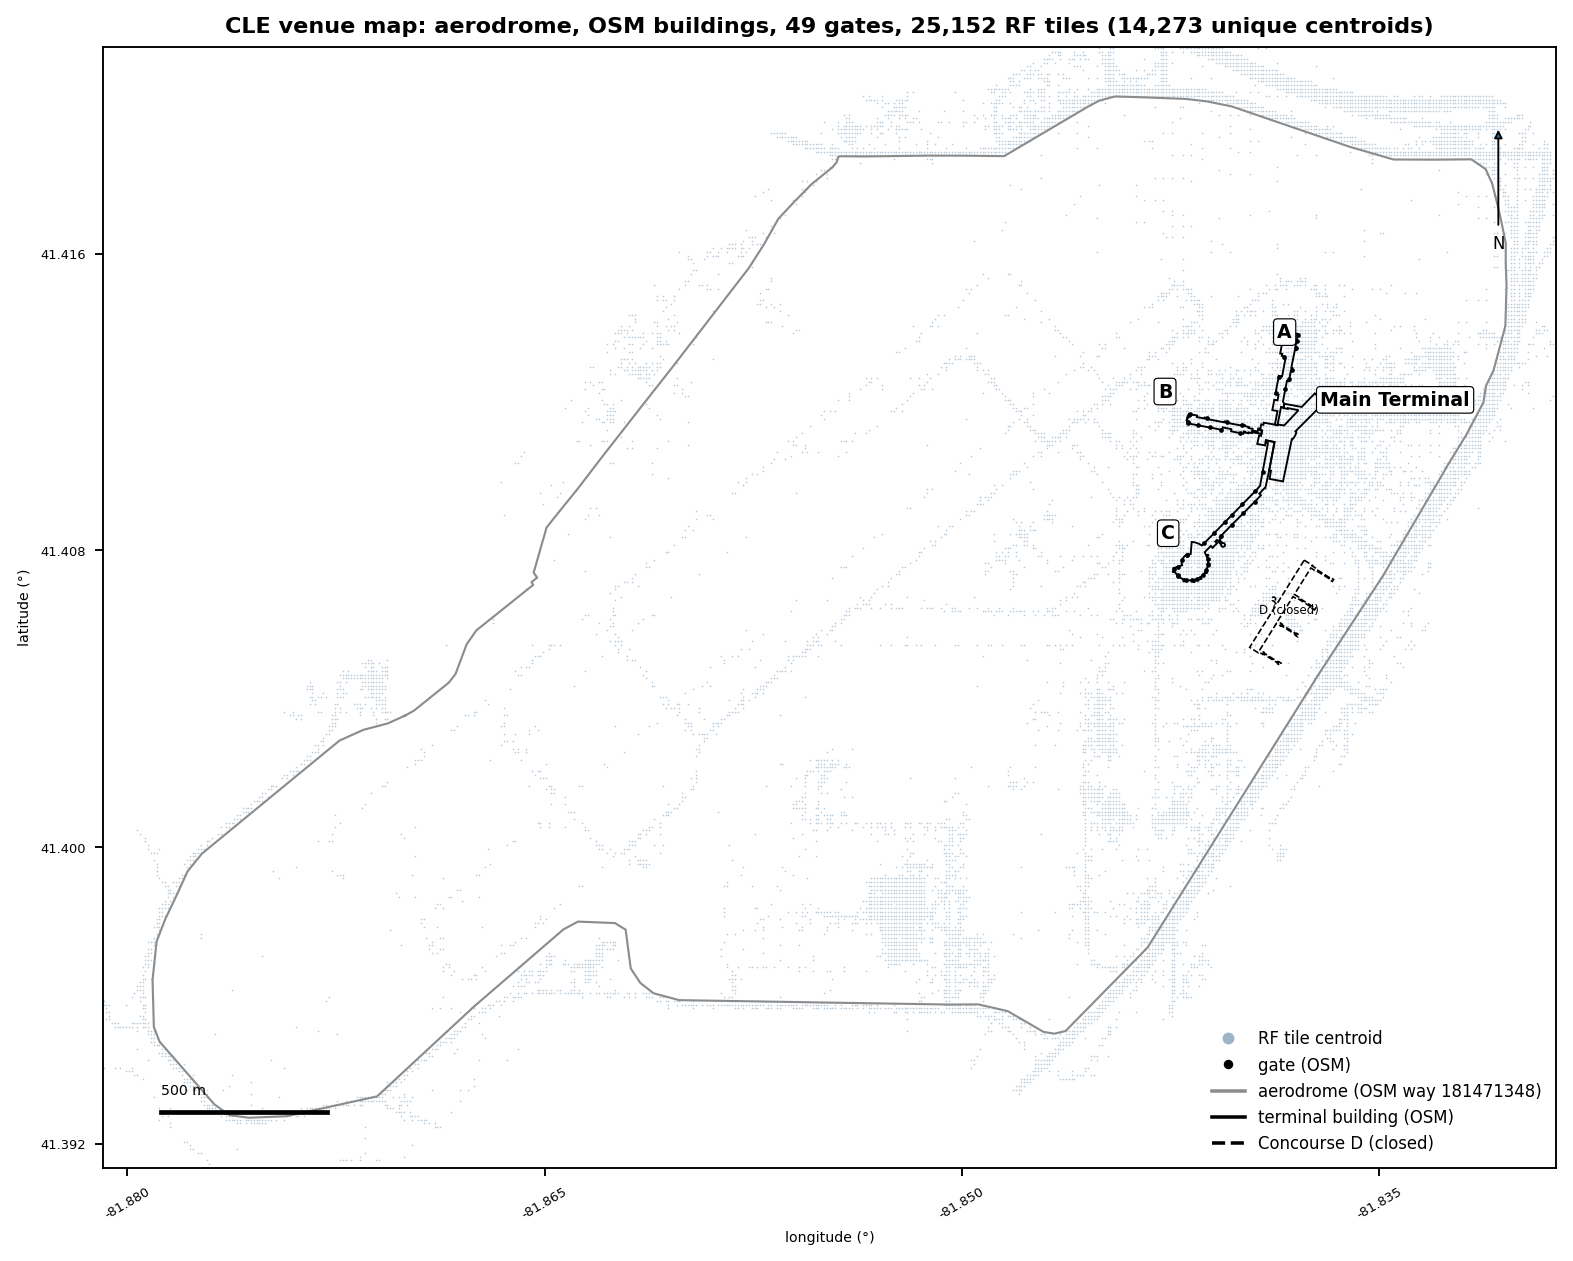
Clipped to the KCLE aerodrome polygon plus 200 m from 168,206 exported · window 2025-08-01 to 2026-07-31
Gate basis
49 gates · 147 gate-carrier pairs
Pinned OpenStreetMap (OSM) inventory: A 13, B 11, C 25. The airport guide lists A 12 and C 23; reconcile against the current gate plan before adopting gate-named criteria
Concourses
A Frontier · B Delta and Southwest · C United, American, JetBlue, Air Canada · D closed
Airline mapping transcribed from public terminal guides (Tier B). Concourse D is closed to passenger service and excluded
Tenant basis
82 mapped points
Google Places (70) + OpenStreetMap (12) capture, pinned 2026-09-08 (Tier B). Food 28 · retail 20 · transport admin 14 · services 8 · lounge 4 · admin 4 · other 3 · lodging 1. Zone attribution: C 24 · Main Terminal 17 · A 12 · B 5 · landside or periphery 24
In-building system
None on record
Reconciled DAS master, 2026-07-28: DAS no · self-owned no · neutral host no Imagine knowledge graph
Neutral-host solicitation
RFP NET-11423, Neutral Host Distributed Antenna System
Released 2024-10-04; proposals due 2024-11-21, extended to 2024-12-09 after two addenda; ten-year term with a five-year renewal; wireless service provider (WSP) agnostic 5G; no capital outlay by CLE. No award appears in the record we hold; the Department holds the current status Imagine knowledge graph
Capital program
CLEvolution, about $1.6B
New terminal 2032 · garage and ground transportation center 2029 · Gold Lot 2027. Per the Imagine knowledge graph
Public Wi-Fi
SSID CLE_Public_WiFi
Per the Imagine knowledge graph; provider not named
Macro-site layer
Queued
Macro-site geometry is queued for the next revision
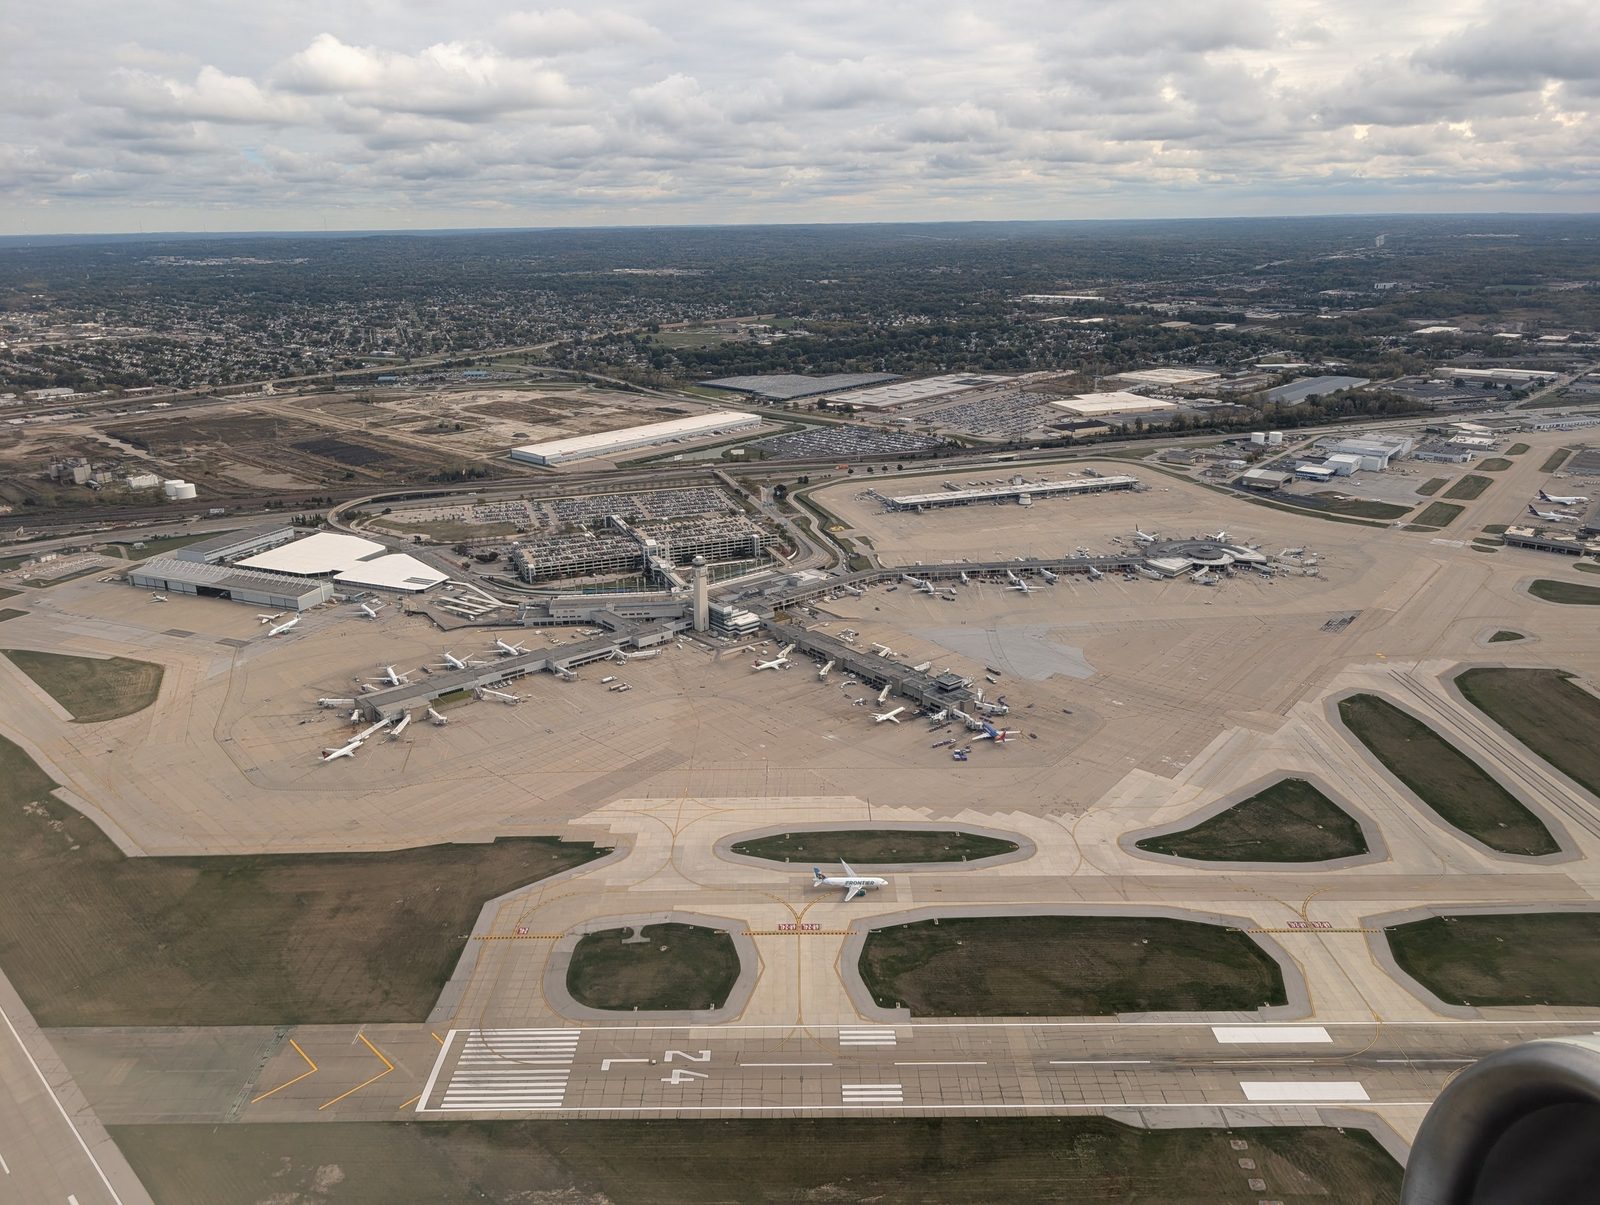
Photo · Terminal complex from the air, October 2025Wikimedia Commons
Photo: Kevin Payravi, CC BY-SA 4.0, via Wikimedia Commons. Illustrative (Tier B), resized only.
Aerodrome = OSM way 181471348 plus 200 m clip. 25,152 RF tiles resolve to 14,273 unique centroids. Source: Ookla Cell Analytics tiles on OpenStreetMap geometry. Window 2025-08-01 to 2026-07-31.
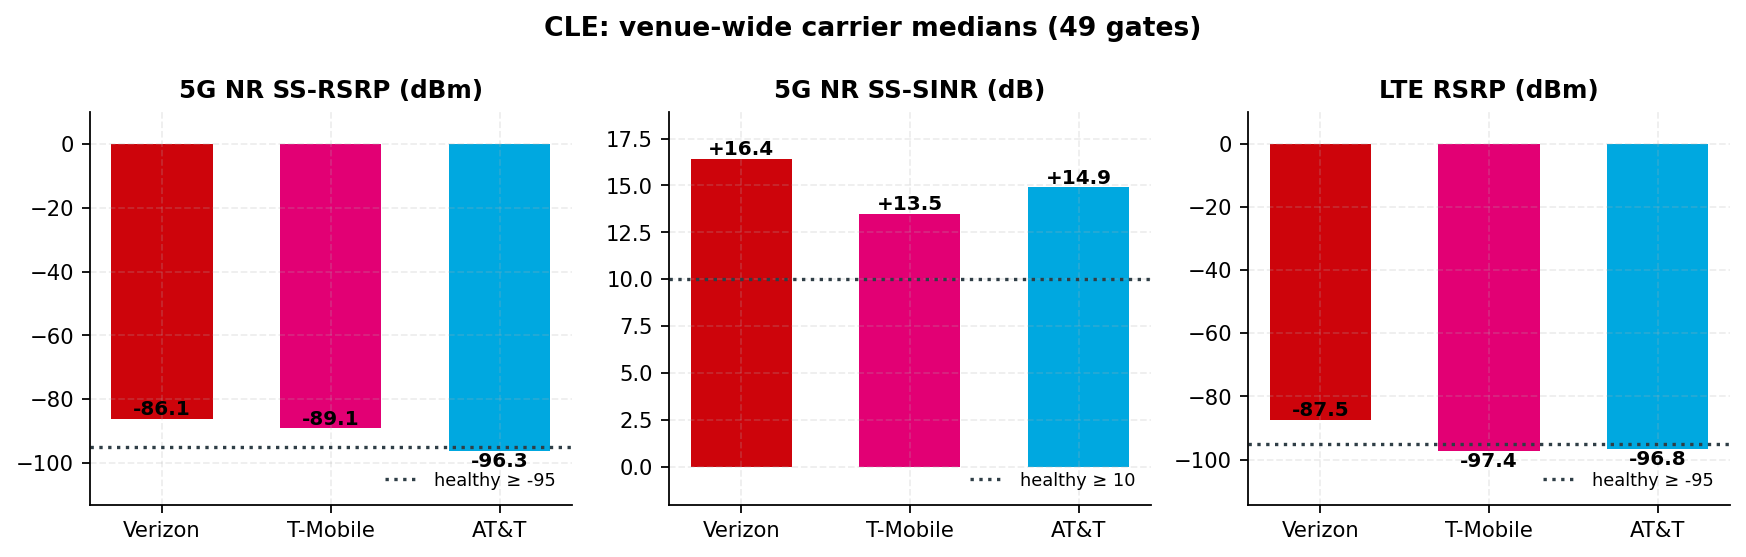
Carriers are ordered by descending gate median 5G RSRP throughout this report. Each gate value
is the mean of tiles within 80 m of the gate point; the venue value is the median across the 49
gates. Every published gate-carrier pair has at least 30 tiles.
Carrier
Gate median 5G
Healthy gates (5G)
At risk
Best 5G NR
Best LTE
Median SINR
Gate median LTE
Verizon
−86.1 dBm
49 / 49
0
34 / 49
46 / 49
+16.4 dB
−87.5 dBm
T-Mobile
−89.1 dBm
49 / 49
0
15 / 49
1 / 49
+13.5 dB
−97.4 dBm
AT&T
−96.3 dBm
10 / 49
39
0 / 49
2 / 49
+14.9 dB
−96.8 dBm
Healthy = gate mean ≥ −95 dBm. SINR healthy (≥ 10 dB): Verizon 49, T-Mobile 49, AT&T 37 of 49 gates.
LTE healthy gates: Verizon 45, AT&T 17, T-Mobile 6 of 49. Full per-gate tables ship in the PDF appendices.
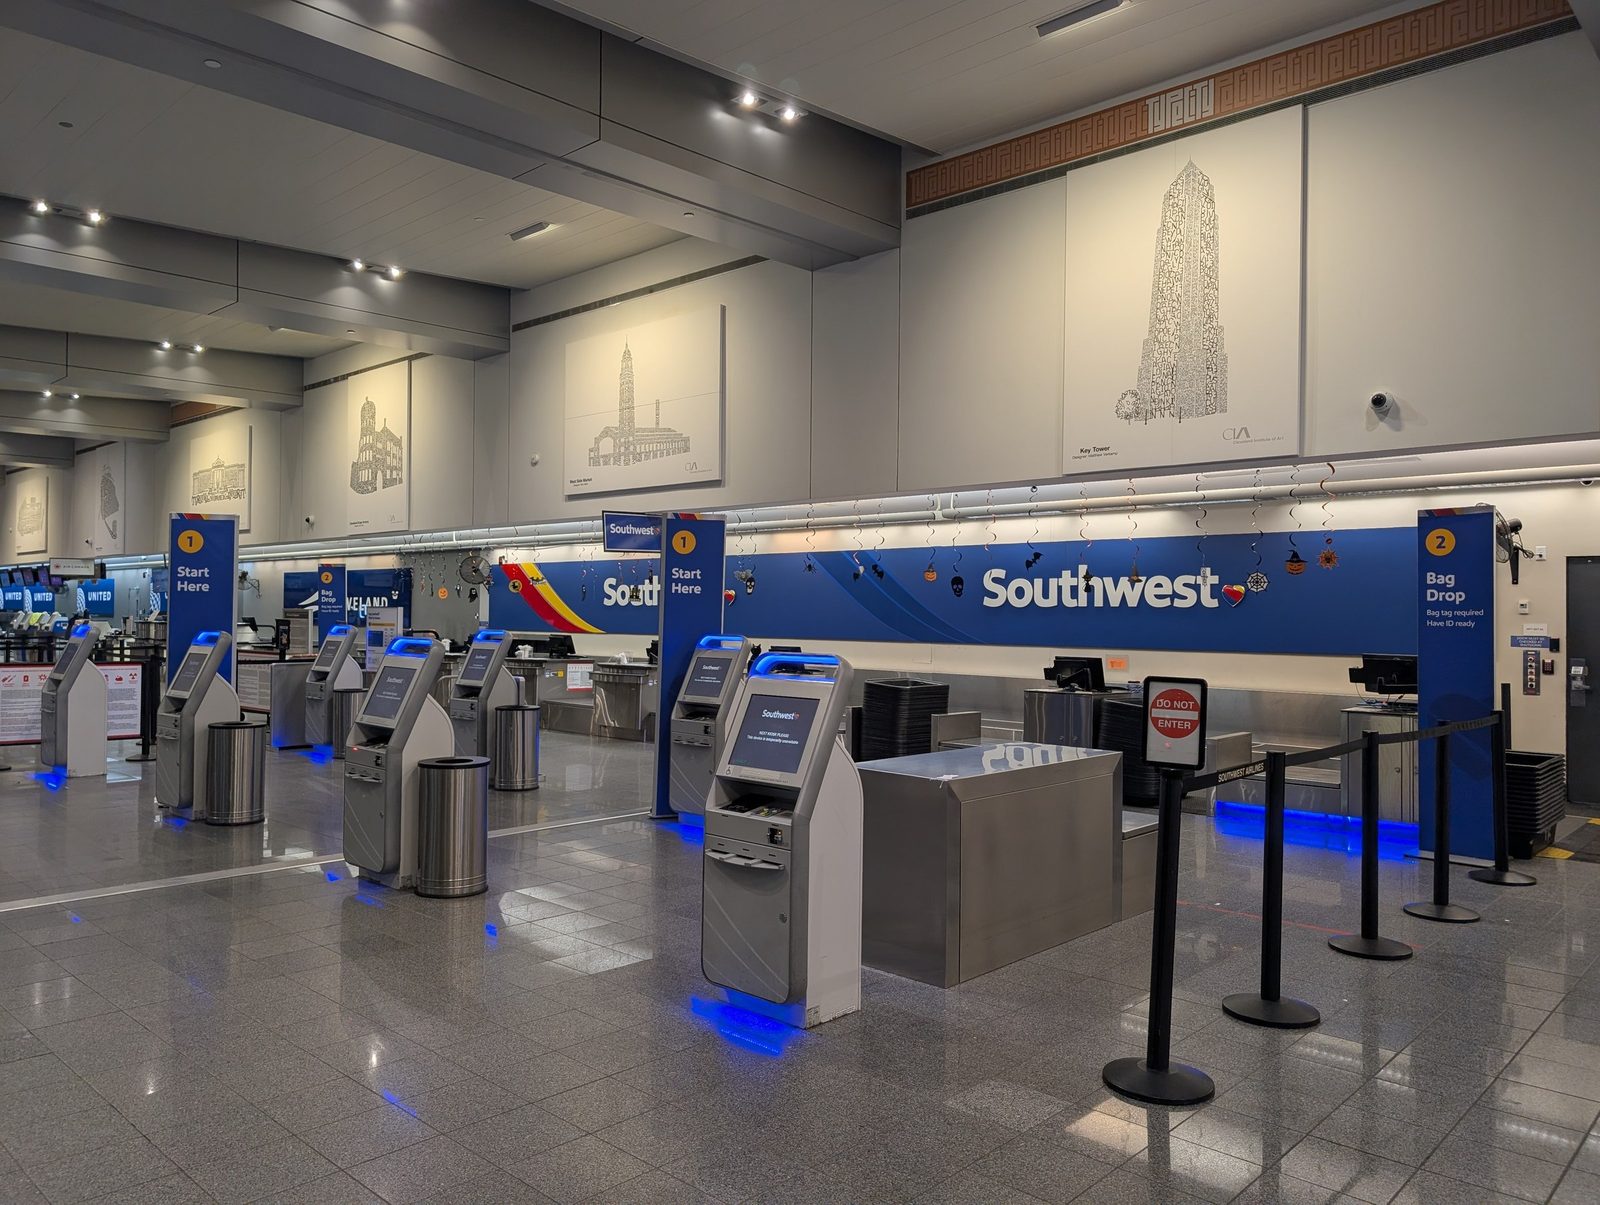
Photo · Main Terminal check-in hall, October 2025Wikimedia Commons
Photo: Kevin Payravi, CC BY-SA 4.0, via Wikimedia Commons. Illustrative (Tier B), resized only.
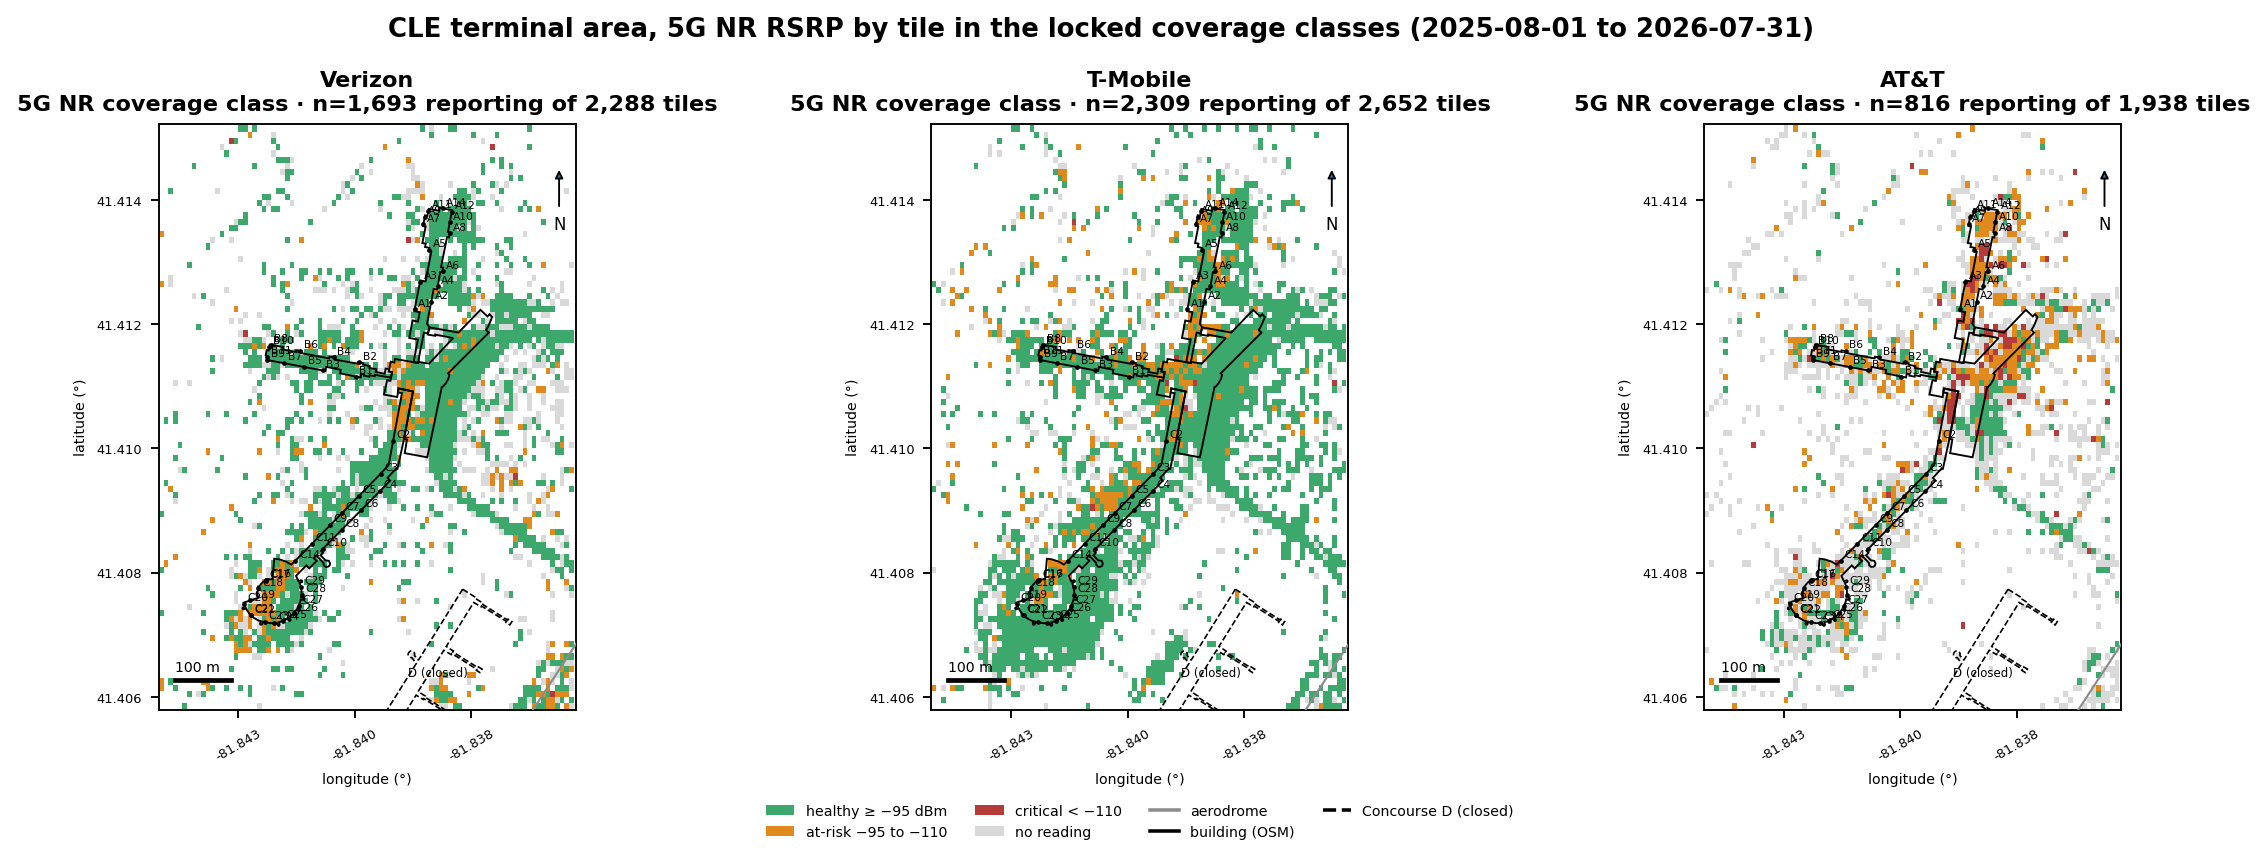
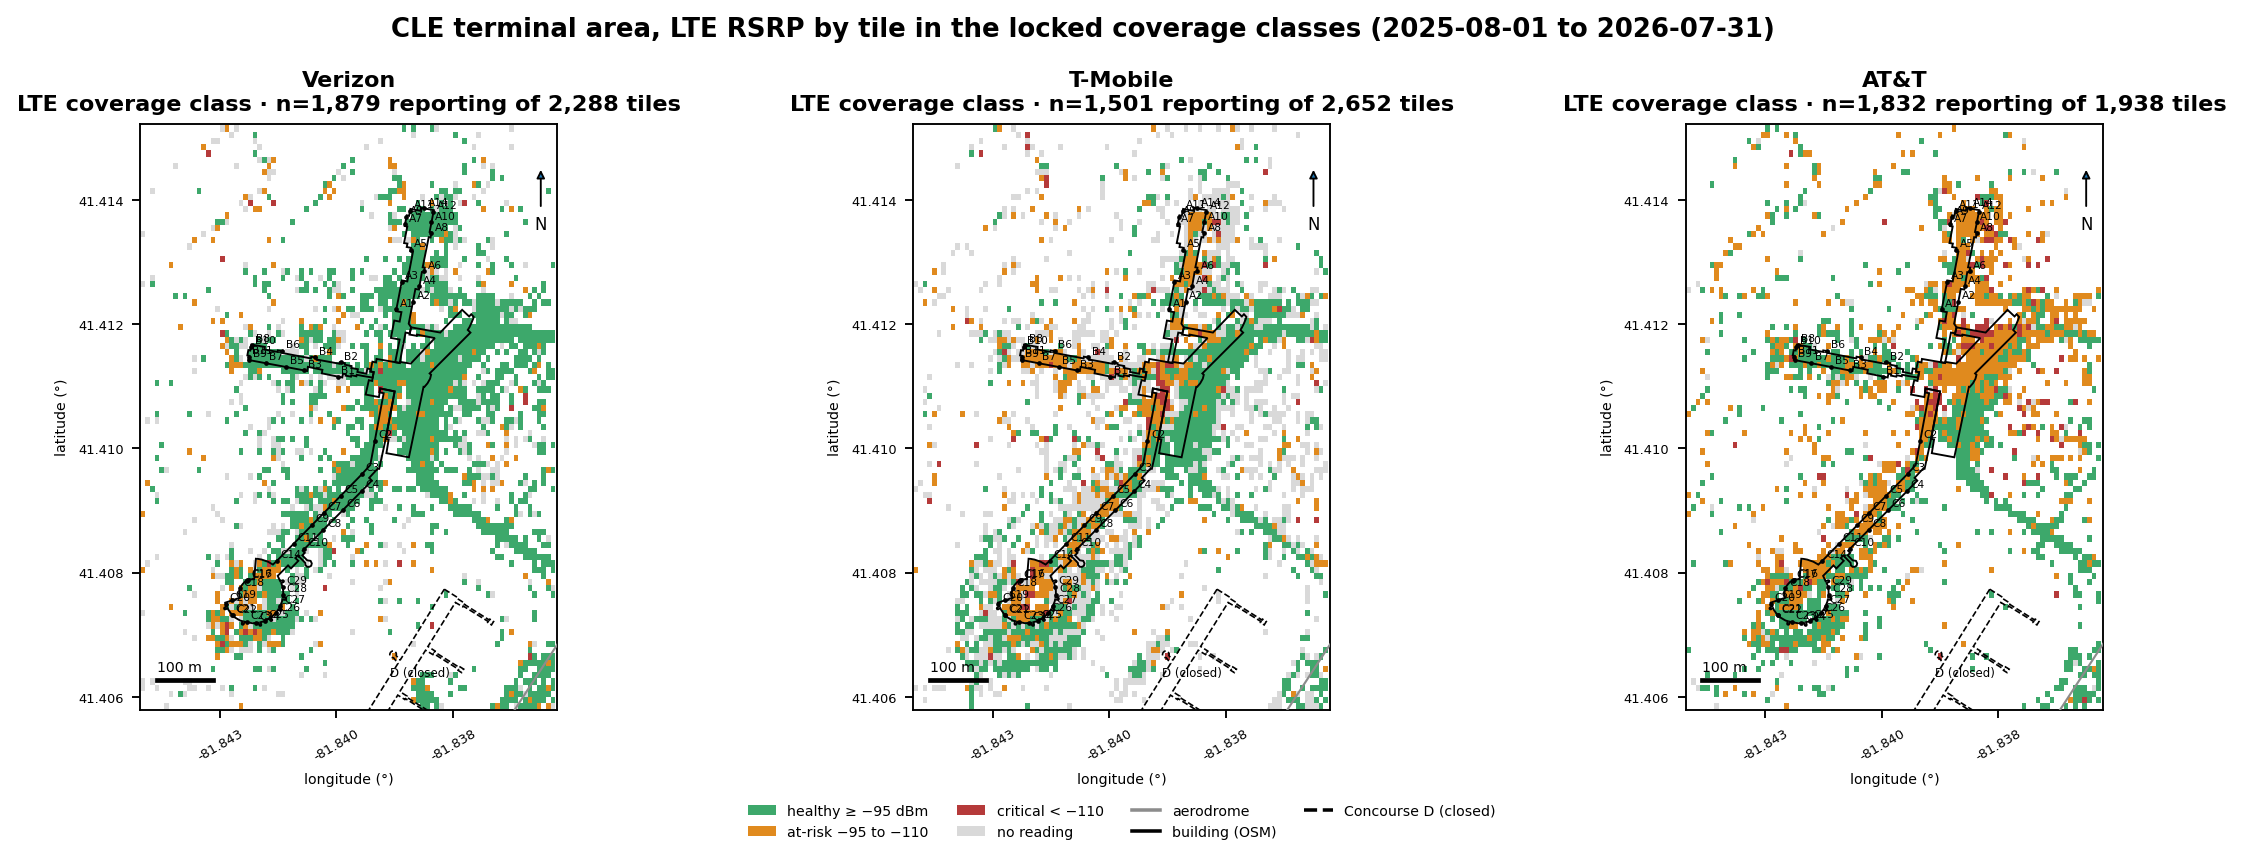
Locked ladder: healthy ≥ −95 · at-risk −95 to −110 · critical < −110 dBm. Window 2025-08-01 to 2026-07-31.
Fig. 3 · 5G NR RSRP by tile · terminal area · locked coverage classSource · Ookla
5G NR RSRP by tile, terminal area, locked coverage class; grey = no 5G reading. Reporting tiles: Verizon 1,693 of 2,288 · T-Mobile 2,309 of 2,652 · AT&T 816 of 1,938. Source: Ookla Cell Analytics. Window 2025-08-01 to 2026-07-31.
Fig. 4 · LTE RSRP by tile · terminal area · locked coverage classSource · Ookla
LTE RSRP by tile, terminal area, locked coverage class; grey = no LTE reading. Reporting tiles: Verizon 1,879 of 2,288 · T-Mobile 1,501 of 2,652 · AT&T 1,832 of 1,938. Source: Ookla Cell Analytics. Window 2025-08-01 to 2026-07-31.
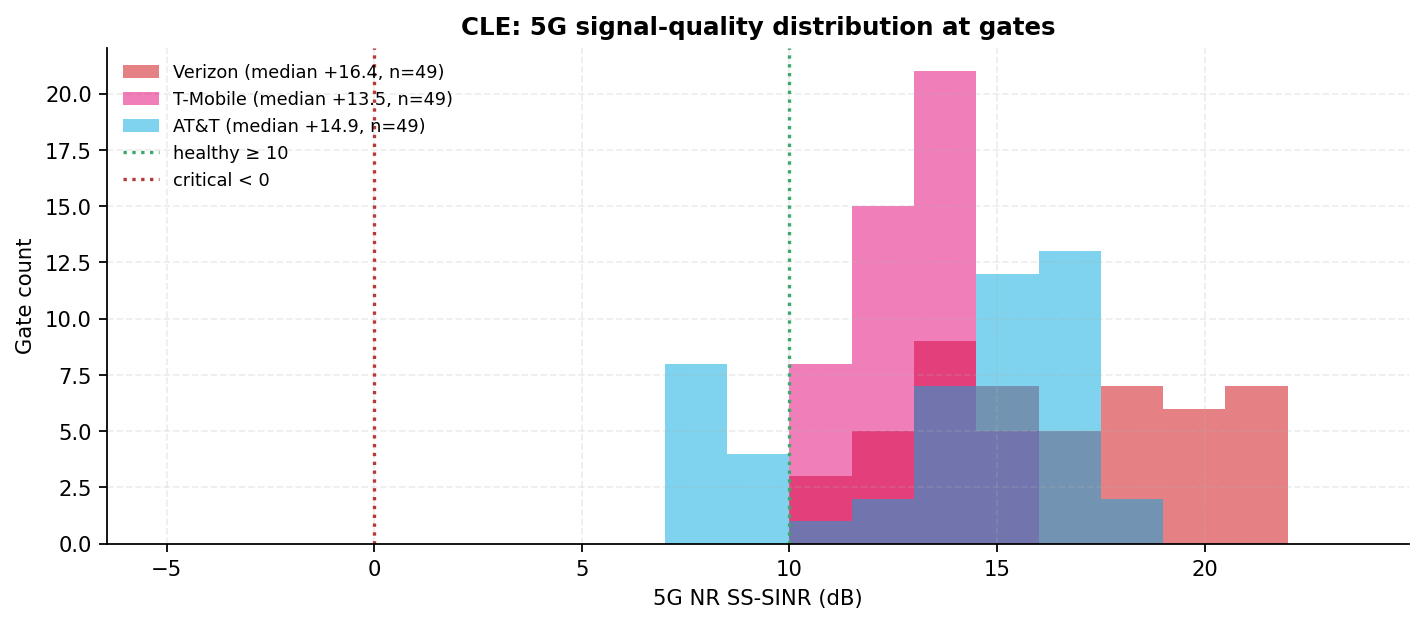
Fig. 5 · SINR distribution per carrier at gate levelSource · Ookla
SINR healthy threshold ≥ 10 dB. AT&T's quality at the gates is healthy where it has a 5G reading; its
gap is coverage, not quality. Window 2025-08-01 to 2026-07-31.
Section 4
Results by zone
A · B · C · Main Terminal · tile basis
Concourses hold fewer than 30 gates each, so zone results use the tile basis: every tile is
assigned to the nearest gate or tenant point with a zone label within 500 m. Healthy share is the
share of a carrier's zone tiles at or above −95 dBm. The smallest published cell holds 133 tiles.
Zone
Verizon healthy
Verizon median
T-Mobile healthy
T-Mobile median
AT&T healthy
AT&T median
Best 5G NR (gate counts)
Concourse A
91%n=869
−84 dBm
87%n=1,213
−87 dBm
46%n=416
−97 dBm
Verizon13 of 13
Concourse B
91%n=308
−87 dBm
71%n=390
−92 dBm
43%n=136
−97 dBm
Verizon11 of 11
Concourse C
76%n=1,510
−88.5 dBm
89%n=2,125
−84 dBm
65%n=488
−91 dBm
T-Mobile 15Verizon 10
Main Terminal
86%n=178
−87 dBm
82%n=205
−81 dBm
42%n=133
−101 dBm
No gatestiles only
Healthy share and median on the tile basis; n = tiles per carrier per zone. Best 5G NR counts are gate counts
(fewer than 30 gates per concourse, reported as counts, never ranked).
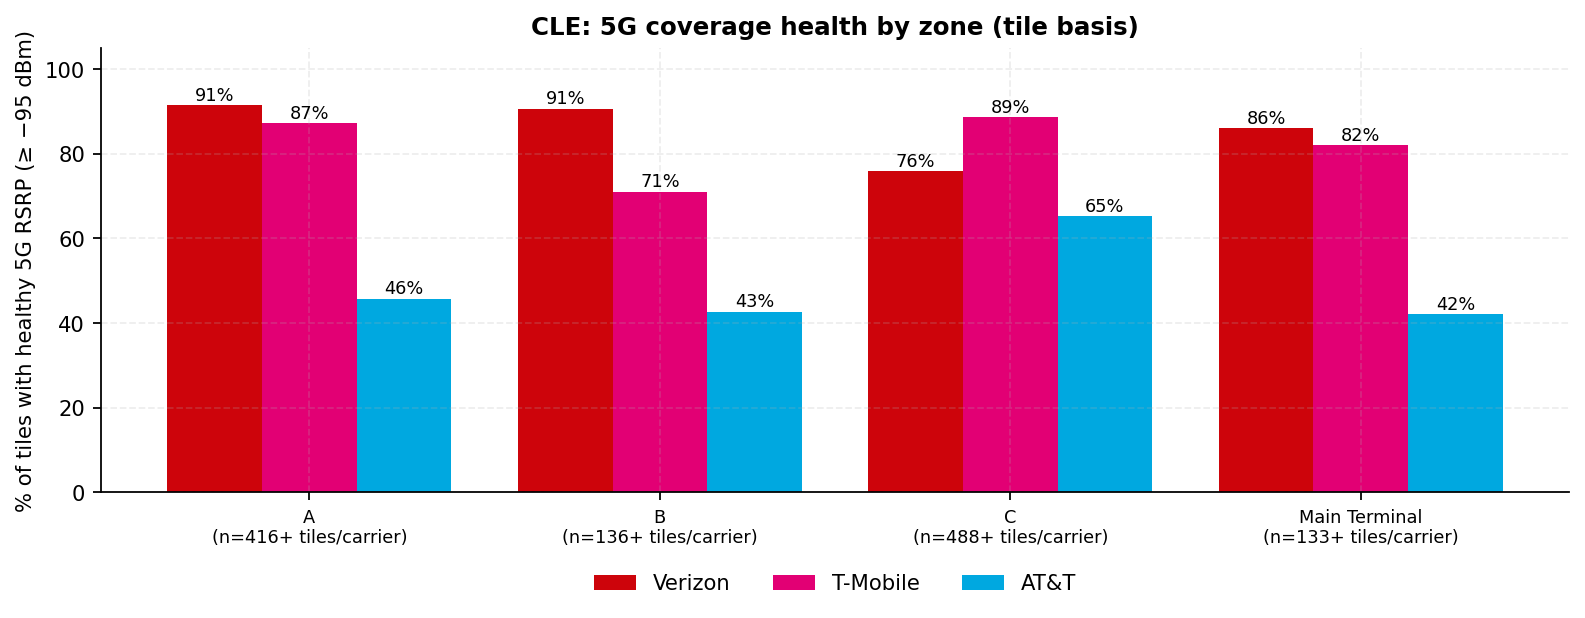
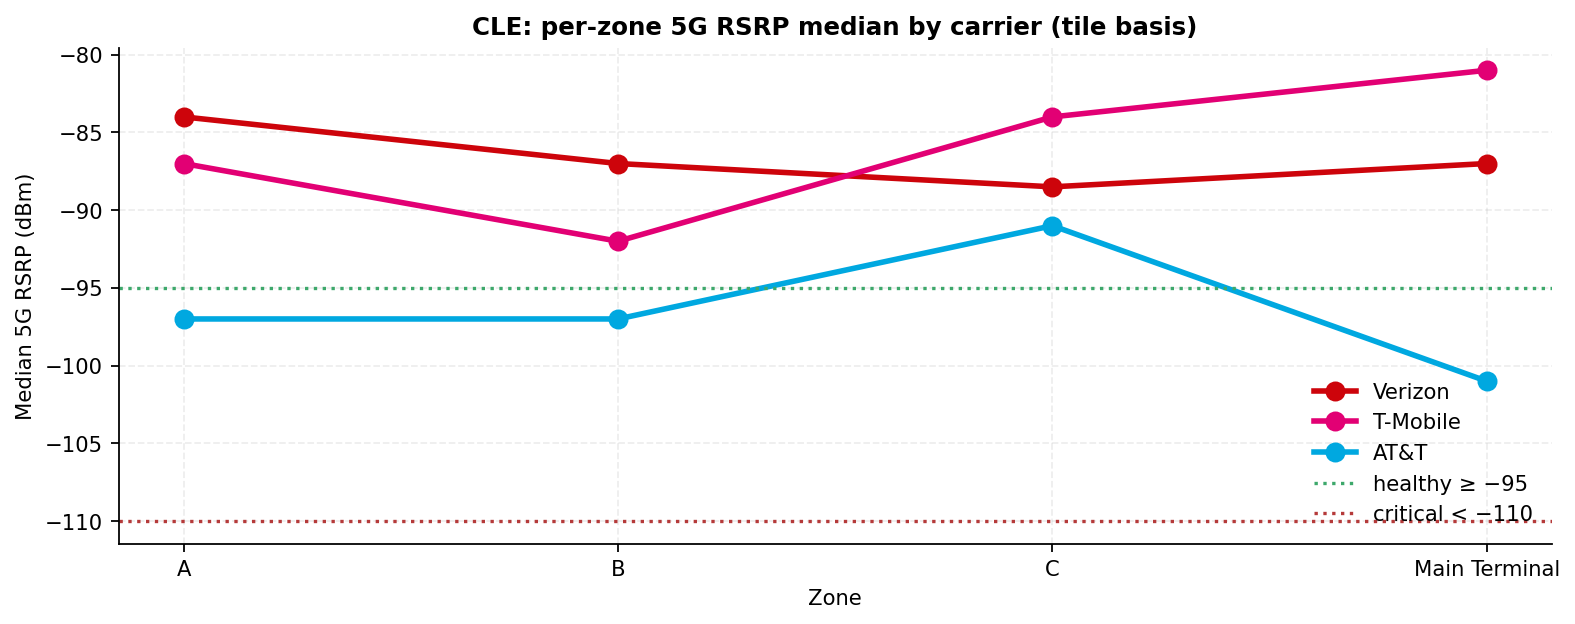
Verizon holds the highest healthy share in A and B. T-Mobile holds the highest healthy share and the
strongest median in C. The Main Terminal splits: T-Mobile holds the stronger median (−81 against −87 dBm)
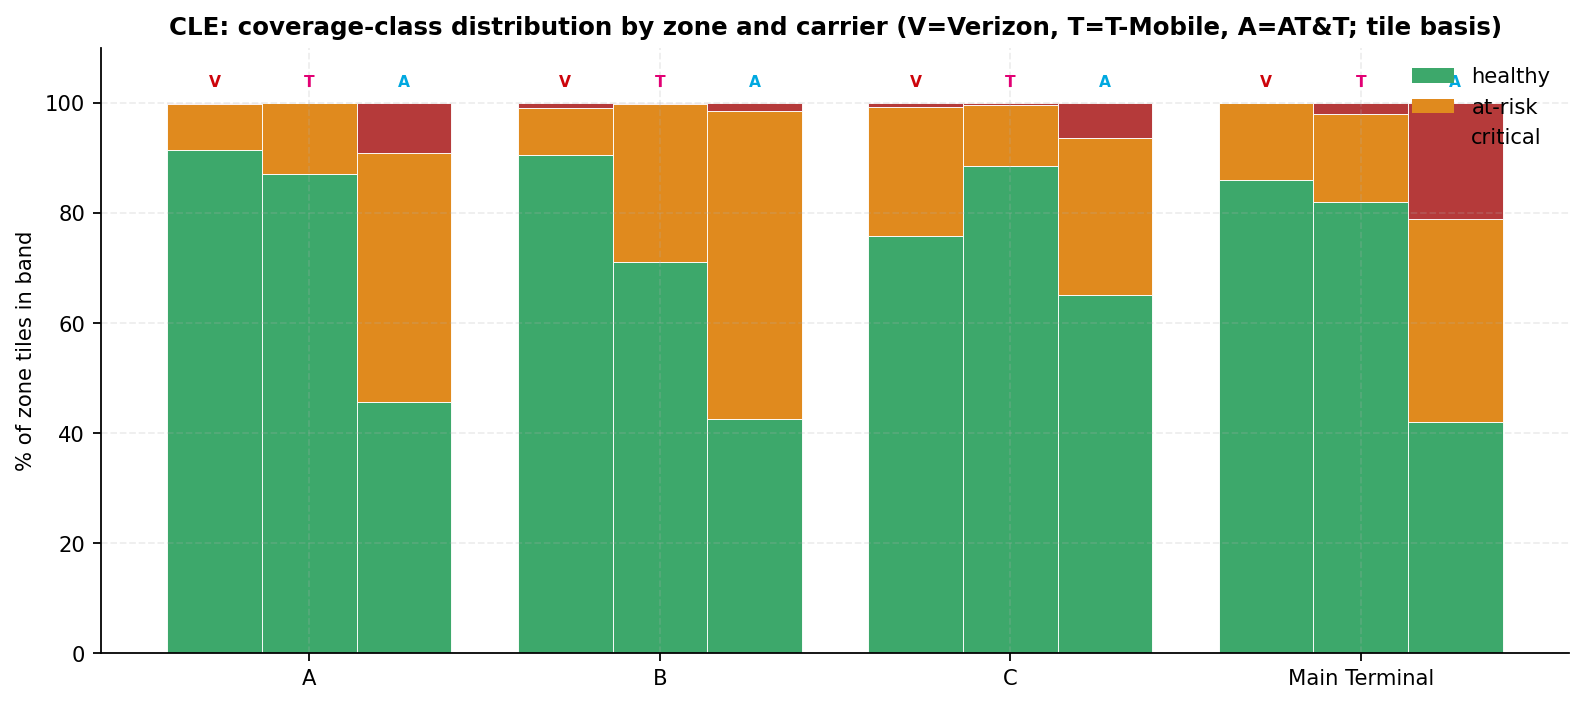
and Verizon the higher healthy share (86% against 82%). AT&T's healthy share stays below 70% in all
four zones, its best zone is Concourse C at 65%, and its Main Terminal median is −101 dBm.
Critical-band gates (< −110 dBm): zero, for every carrier.
Fig. 6 · Healthy 5G tile share by zone and carrierSource · Ookla
Fig. 7 · Median 5G RSRP by zone and carrierSource · Ookla
Fig. 8 · Coverage-class distribution by zone and carrierSource · Ookla
V = Verizon, T = T-Mobile, A = AT&T. Tile basis; n per zone on the axis. Window 2025-08-01 to 2026-07-31.
Building-masked view
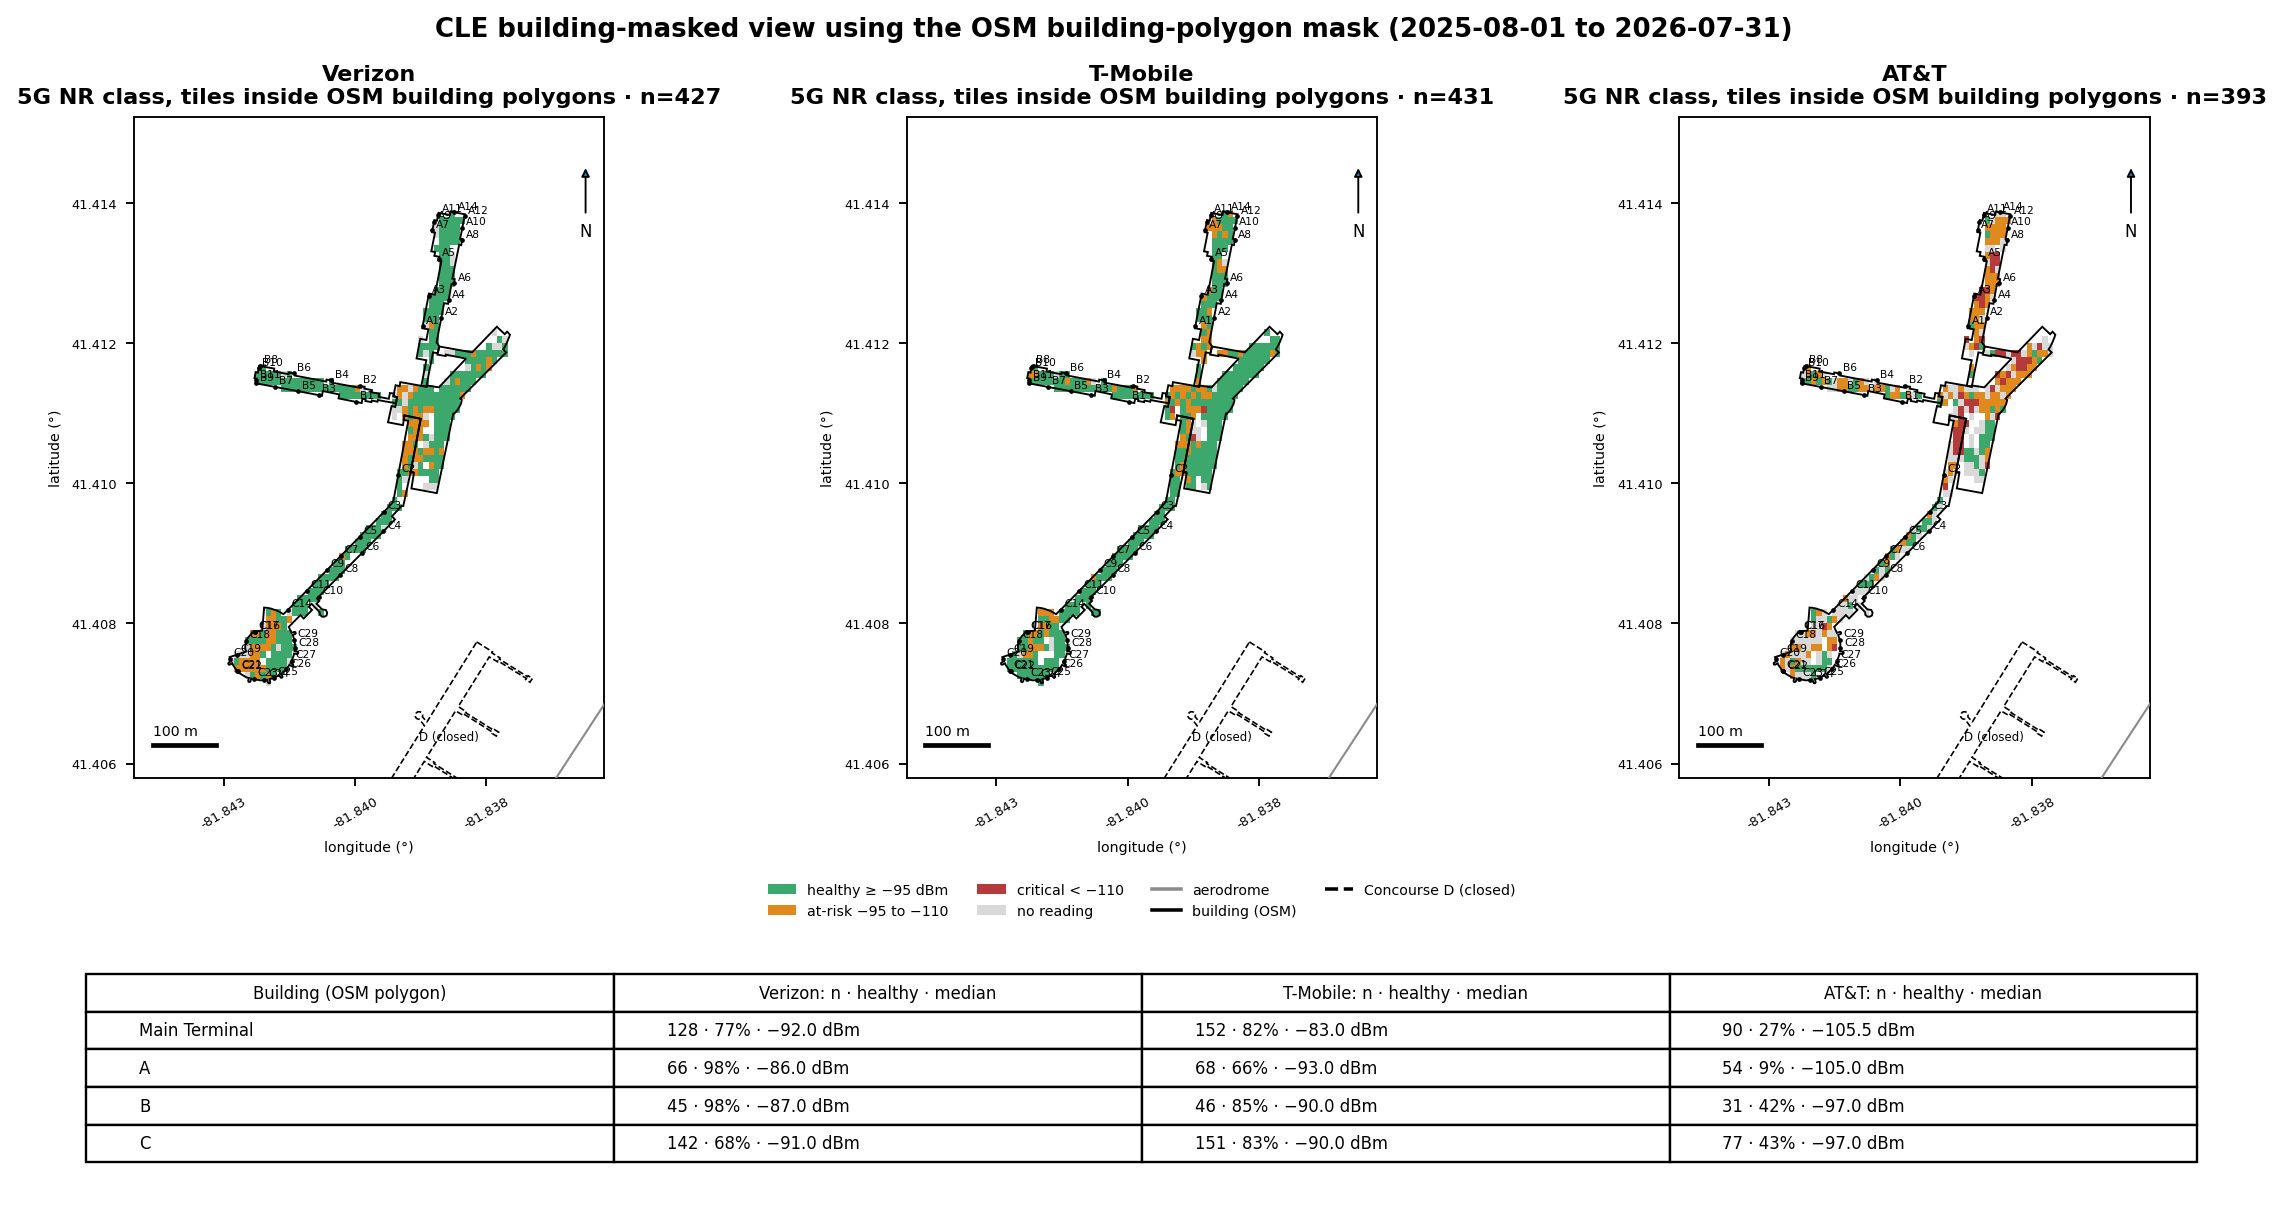
Fig. 9 · Building-masked view · 5G NR class for tiles inside the OSM footprintsSource · Ookla
Tiles inside the pinned OSM building polygons: Verizon n=427 · T-Mobile n=431 · AT&T n=393. Building-polygon mask is ours; the Ookla Indoor layer is queued. Source: Ookla Cell Analytics on OpenStreetMap footprints. Window 2025-08-01 to 2026-07-31.
Building (OSM polygon)
Verizon healthy · median
T-Mobile healthy · median
AT&T healthy · median
Main Terminal
77% · −92.0 dBmn=128 tiles
82% · −83.0 dBmn=152 tiles
27% · −105.5 dBmn=90 tiles
Concourse A
98% · −86.0 dBmn=66 tiles
66% · −93.0 dBmn=68 tiles
9% · −105.0 dBmn=54 tiles
Concourse B
98% · −87.0 dBmn=45 tiles
85% · −90.0 dBmn=46 tiles
42% · −97.0 dBmn=31 tiles
Concourse C
68% · −91.0 dBmn=142 tiles
83% · −90.0 dBmn=151 tiles
43% · −97.0 dBmn=77 tiles
Healthy = tile 5G RSRP ≥ −95 dBm; median over tiles inside the polygon. n counts tiles, not scans.
This view is our building-polygon mask: tile centroids that fall inside the pinned OpenStreetMap
footprints. It is not Ookla's Indoor layer, which is queued for the next revision. Inside the buildings
AT&T is healthy on 27% of Main Terminal tiles and 9% of Concourse A tiles, against 77% to 98% for
Verizon. The carrier ranking in section 3 does not change.
How to read a tile map
Each tile is 0.0001° by 0.0001°, about 8 m by 11 m, and is colored by the locked ladder from the tile's
aggregated RSRP over the window. A tile with no reading had no 5G sample from the Android panel in the
window. That means no measurement, not no coverage. Gate labels mark the pinned OSM gate points.
Section 5
Cross-carrier concordance
One-carrier-weak vs all-weak gates
This split decides what a neutral-host system would fix. A gate weak for all three carriers points
to the building, its geometry, or propagation. A gate weak for exactly one carrier points to that
carrier's path.
10
Gates healthy for all three carriers · all in Concourse C
39
Gates weak for exactly one carrier · AT&T at 39 of 39
0
Gates weak for two carriers
0
Gates weak for all three carriers
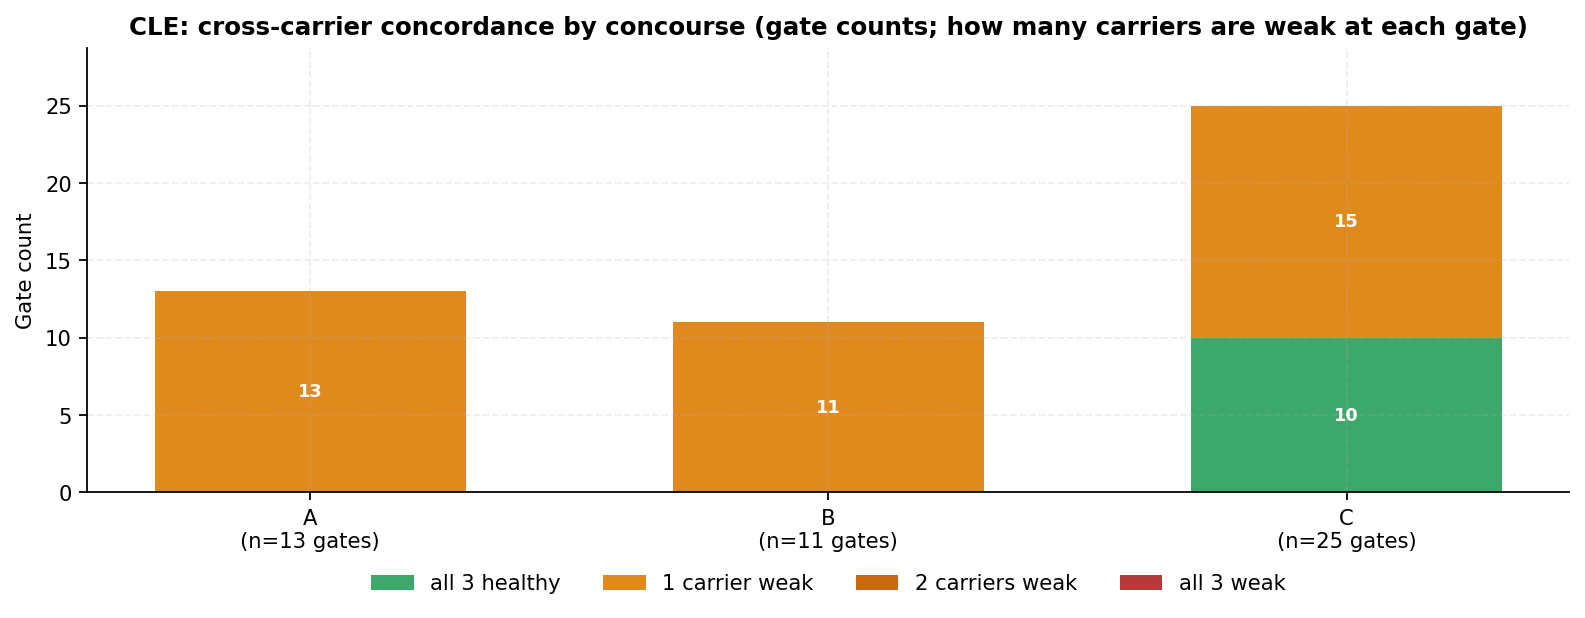
By concourse: A holds 13 one-carrier-weak gates, B holds 11, and C holds 10 all-healthy gates plus 15
one-carrier-weak gates. The tiles show no gate-wide propagation problem. The weakness is
AT&T-specific. A neutral-host system would address it as a hosted AT&T path. The concordance
does not by itself demonstrate a building problem.
Fig. 10 · Carriers below the healthy line per gate, by concourseSource · Ookla
Gate counts. Healthy = gate mean 5G RSRP ≥ −95 dBm. Window 2025-08-01 to 2026-07-31.
Section 6
Concourse C and Main Terminal
25 C gates · densest zone
Concourse C
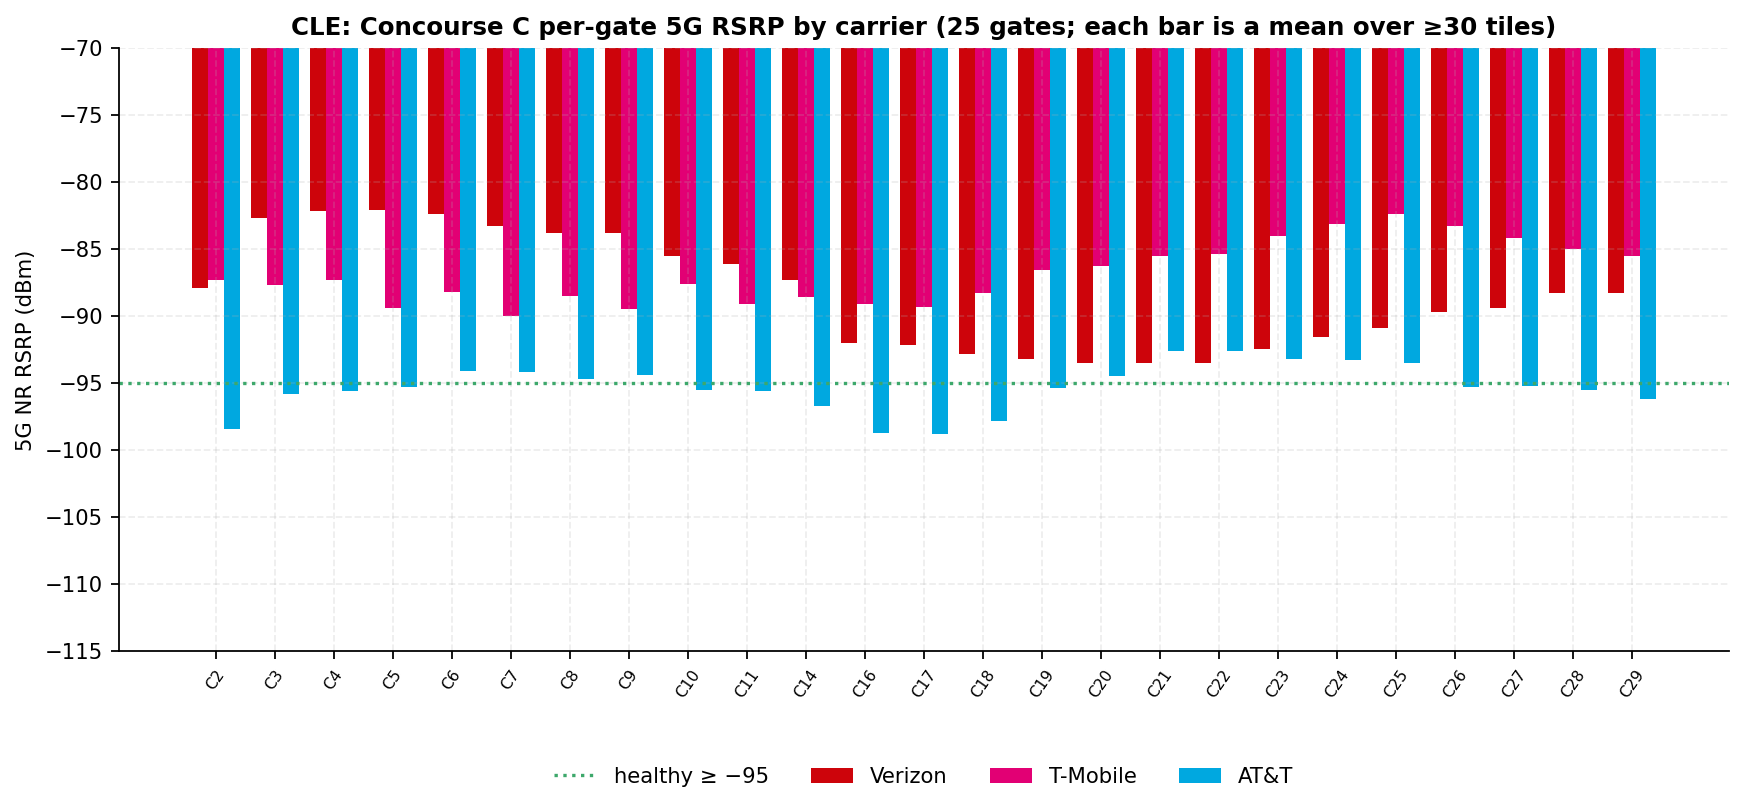
Concourse C is the largest zone (25 gates; United, American, JetBlue, Air Canada) and the one zone
where the carrier order changes. T-Mobile holds best 5G NR at 15 of 25 gates and Verizon at 10.
On the tile basis T-Mobile's median is −84 dBm against Verizon's −88.5 dBm, and T-Mobile is healthy on
89% of tiles against Verizon's 76%. AT&T's healthy share reaches 65% here, its highest of the four
zones, and all 10 all-healthy gates in the venue sit in C.
Each bar is a mean over at least 30 tiles within 80 m of the gate. Window 2025-08-01 to 2026-07-31.
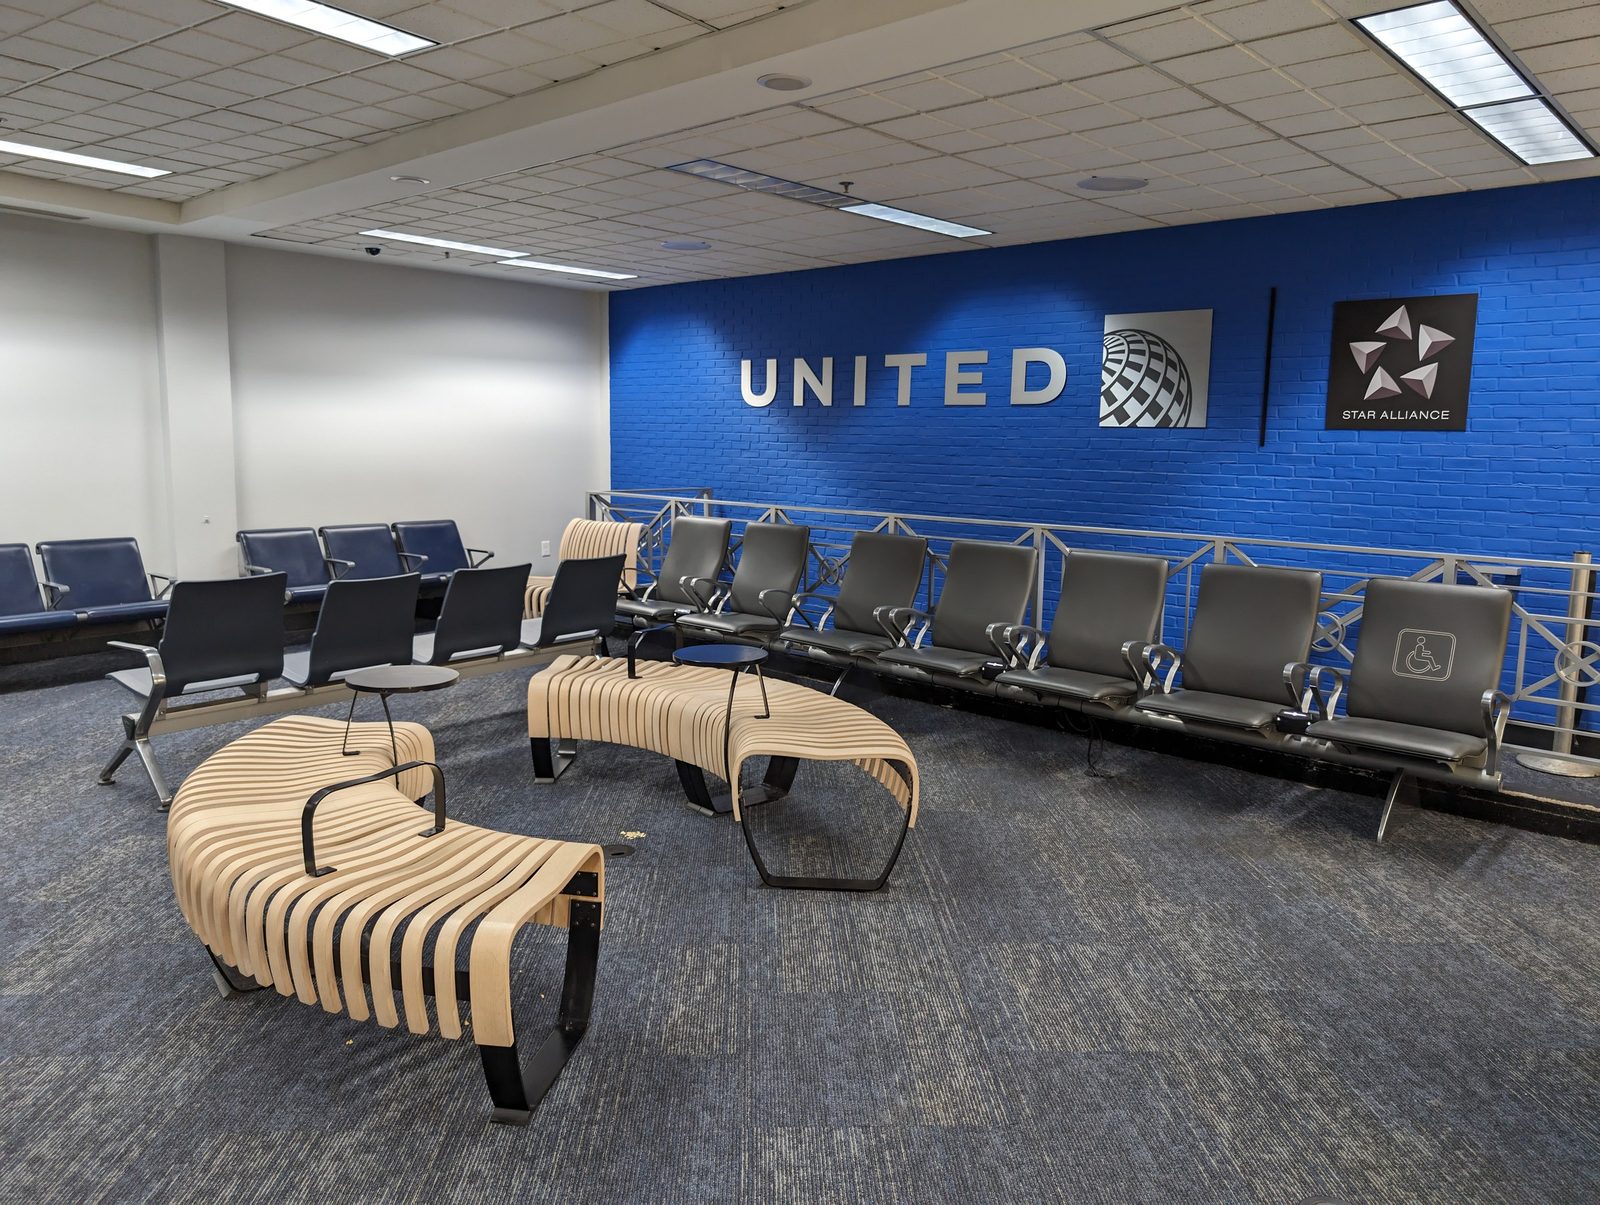
Photo · Concourse C, United seating areaWikimedia Commons
Photo: Kevin Payravi, CC BY-SA 4.0, via Wikimedia Commons. Illustrative (Tier B), resized only.
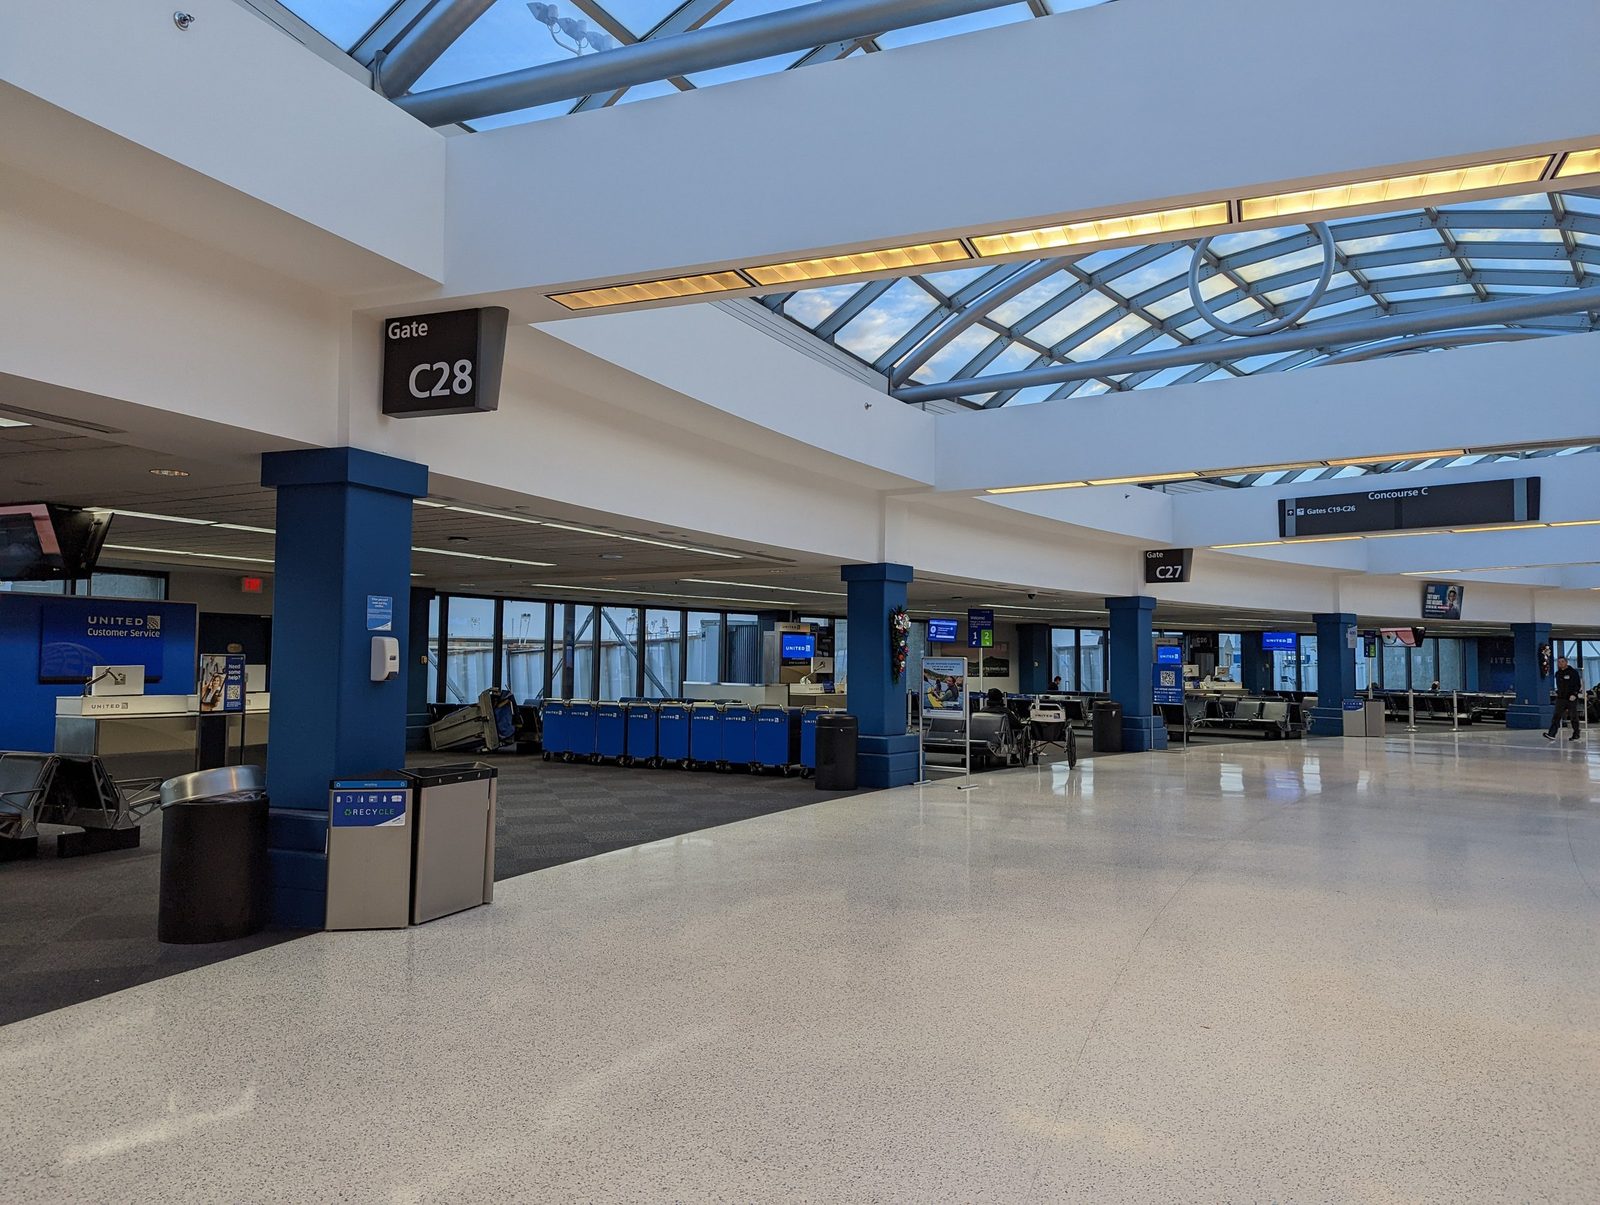
Photo · Concourse C, gate C28Wikimedia Commons
Photo: Kevin Payravi, CC BY-SA 4.0, via Wikimedia Commons. Illustrative (Tier B), resized only.
Main Terminal
The Main Terminal holds no gates, so it is read on tiles only. The two leading carriers split
the zone: T-Mobile holds the stronger median (−81 dBm against Verizon's −87 dBm) and Verizon the
higher healthy share (86% of tiles against 82%). AT&T is healthy on 42% of Main Terminal tiles
with a median of −101 dBm, its weakest zone median and the one zone where its critical share rises.
The zone carries the highest unique-device density in the venue (median 22 per tile, p95 66) and
ranks first on the density-weighted weak share (section 10).
Concourses A and B
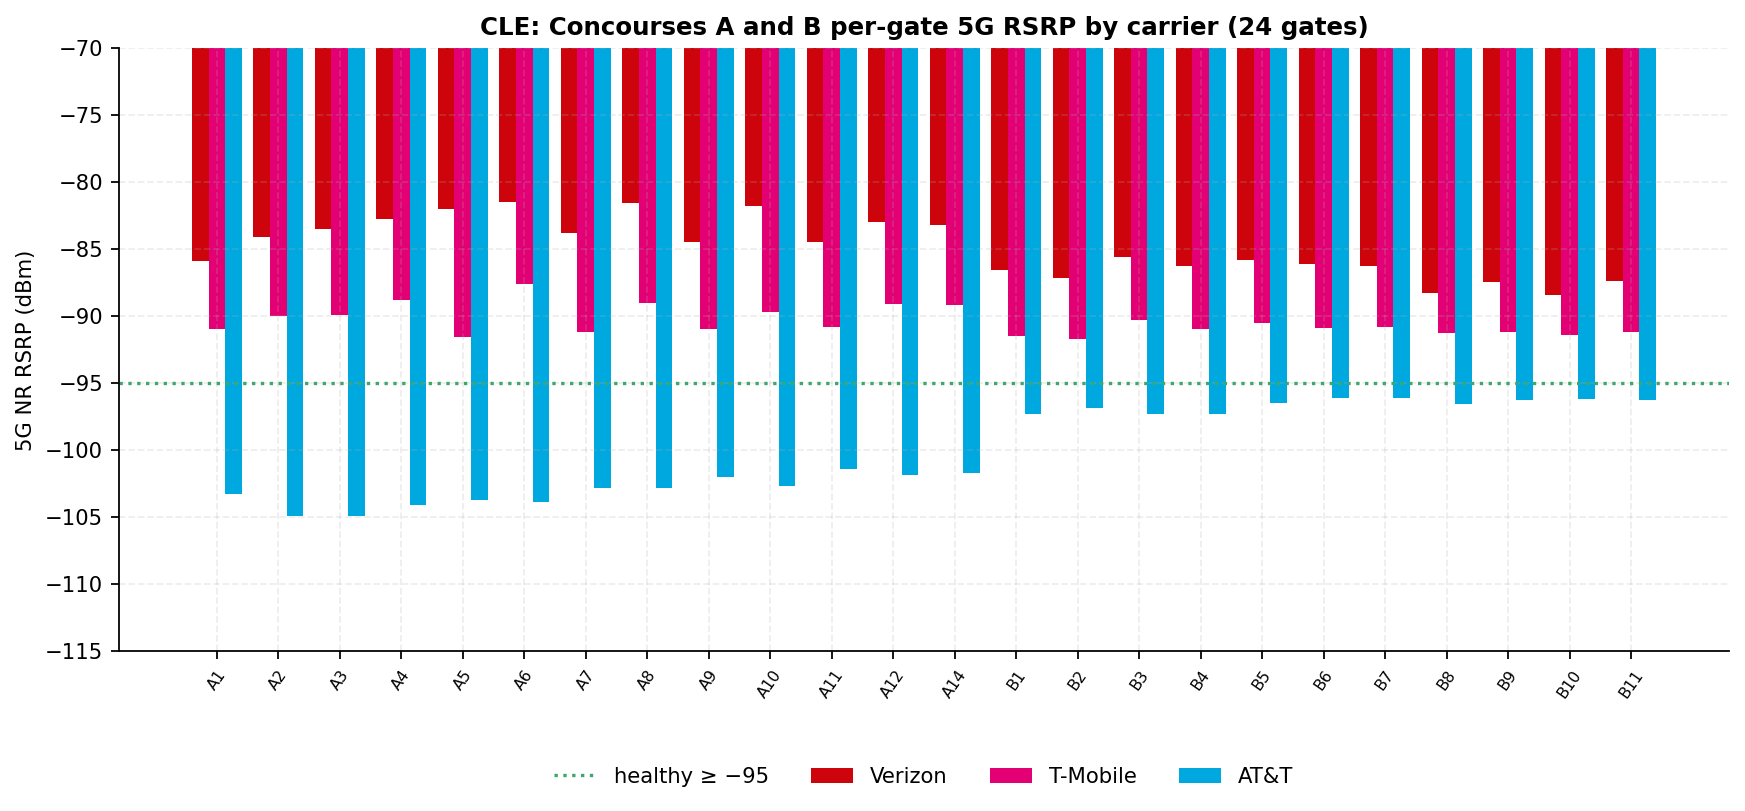
Verizon holds best 5G NR at all 24 A and B gates. AT&T is healthy on 46% of Concourse A tiles and
43% of Concourse B tiles, and the five largest carrier spreads in the venue sit at Concourse A gates
(section 11).
Fig. 12 · Per-gate 5G RSRP · 24 Concourse A and B gatesSource · Ookla
Frontier in A; Delta and Southwest in B (Tier B). Window 2025-08-01 to 2026-07-31.
Photo: Cards84664, CC BY-SA 4.0, via Wikimedia Commons. Illustrative (Tier B), resized only.
Section 7
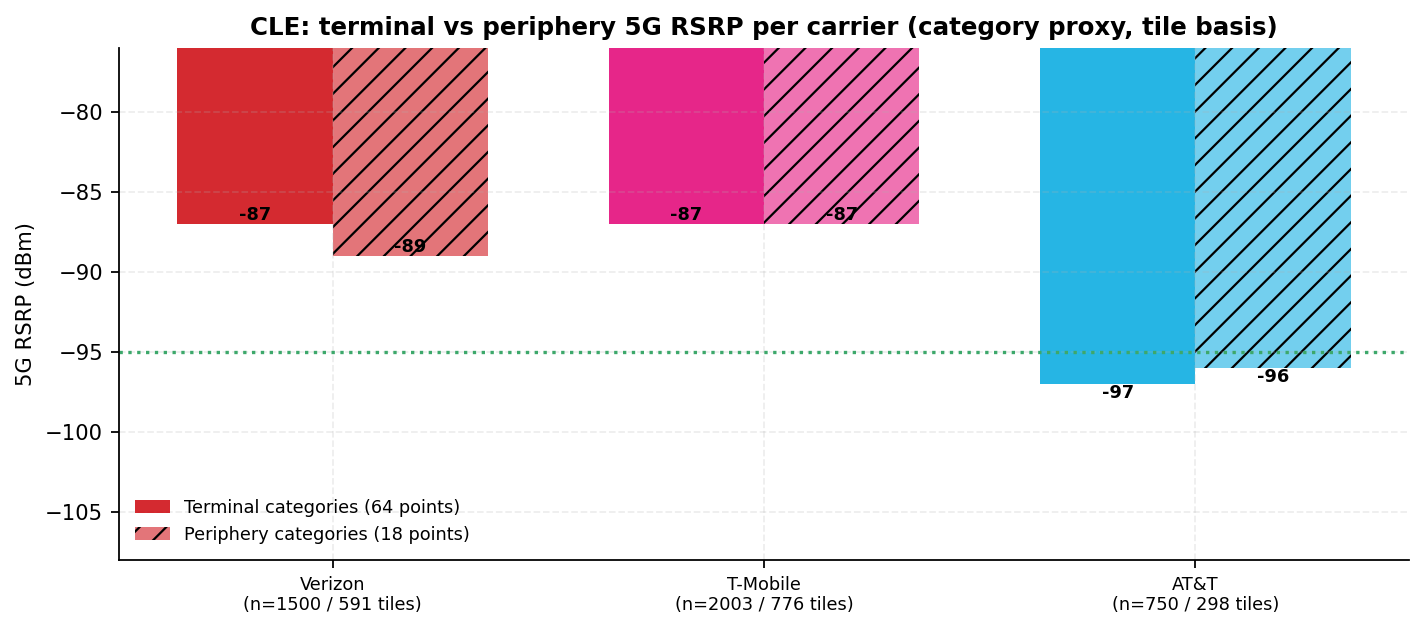
Terminal vs periphery proxy
Category proxy · tile basis
This proxy compares each carrier's median 5G RSRP over tiles near terminal-category points (retail,
food, lounge, admin, services) with tiles near periphery-category points (transport admin, lodging,
other). A large positive periphery-minus-terminal delta is the macro-spillover signature. A flat
delta is ambiguous between a close-in macro site and an unrecorded in-building asset.
Fig. 13 · Median 5G RSRP · terminal vs periphery tenant categoriesSource · Ookla
Proxy: category-based masking on 82 mapped points (Google Places + OpenStreetMap, pinned 2026-09-08), not Ookla's building-polygon mask.
Window 2025-08-01 to 2026-07-31.
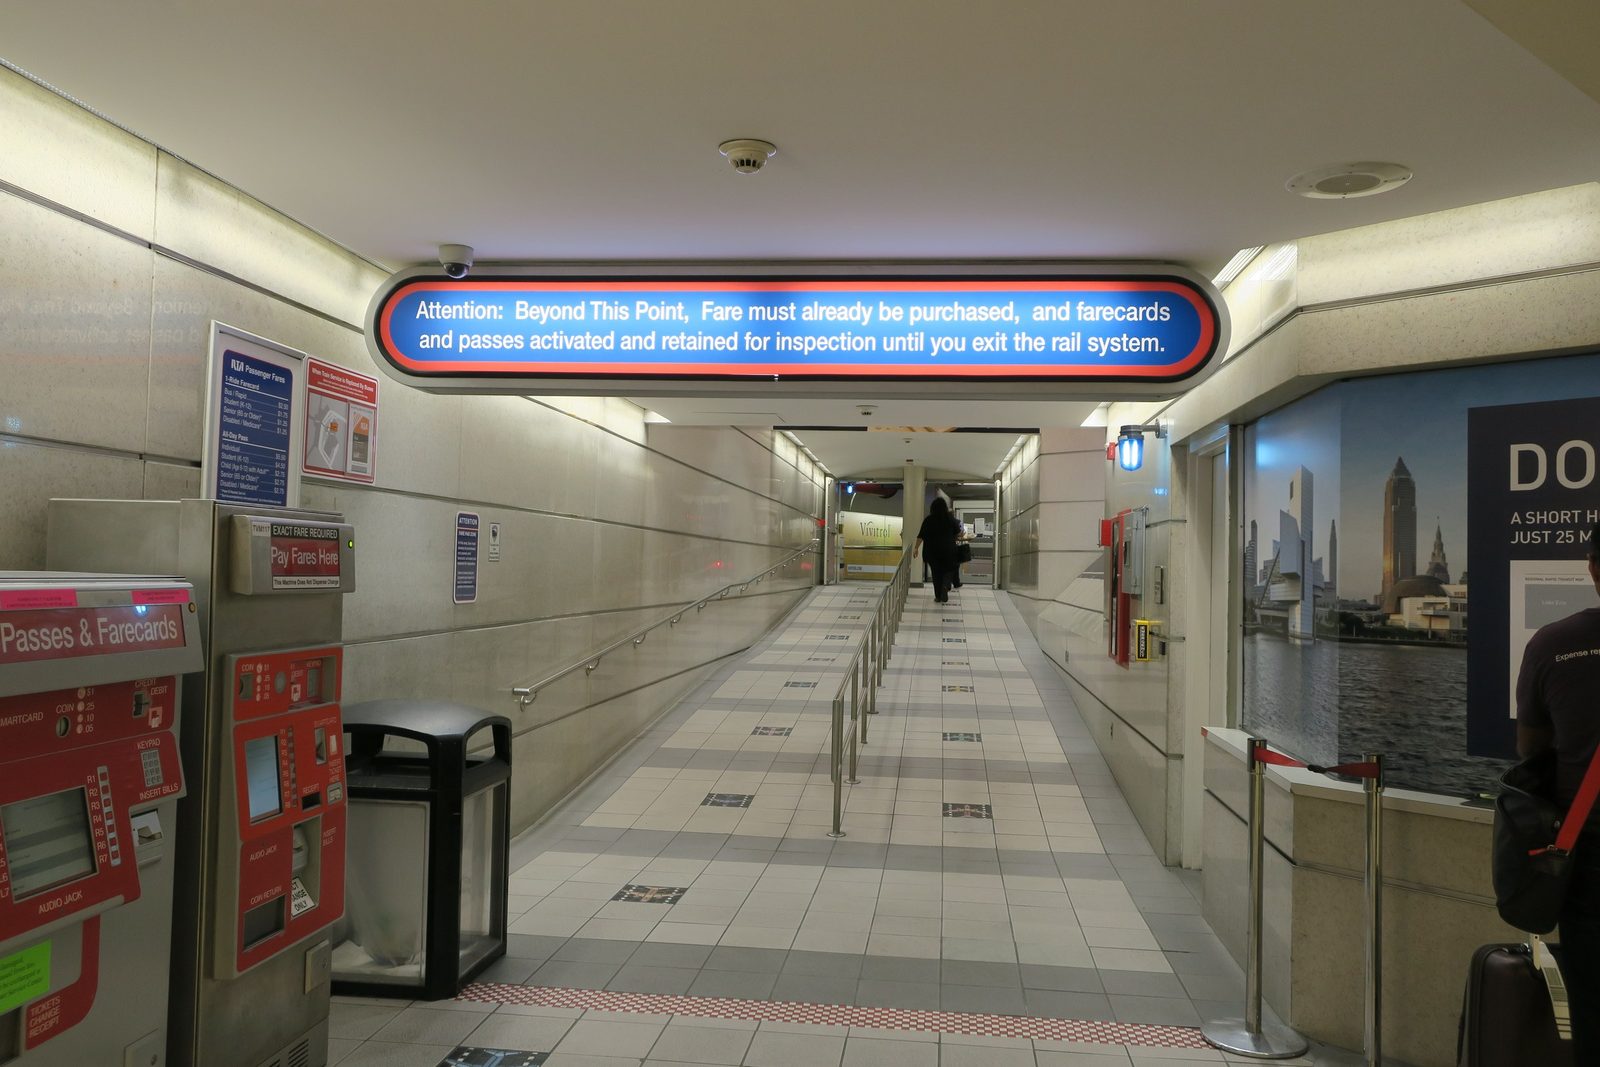
Photo · RTA Red Line station entrance, a periphery-category pointWikimedia Commons
Photo: Jacob G., CC BY-SA 4.0, via Wikimedia Commons. Illustrative (Tier B), resized only.
Section 8
Carrier attestation of coverage sources
Coverage-source attestation
The record we hold lists no in-building system at CLE, yet two carriers reach the gates with flat
terminal-to-periphery deltas and healthy readings at 49 of 49 gates. The tile export cannot say
what carries them.
Verizon (−2.0 dB) and T-Mobile (0.0 dB) show flat deltas. Each is consistent with a close-in macro
grid reaching the terminal, and each is also consistent with an in-building asset that the reconciled
DAS master does not record. AT&T's +1.0 dB delta is slightly periphery-stronger, consistent with but
not proof of macro spillover; its 39 at-risk gates point the same way. This report converts the ambiguity into an attestation question: each
carrier states the source of its terminal coverage before any DAS design freezes.
Attestation scope
Tile aggregates measure signal, not infrastructure. Macro-site geometry is queued for the next
revision, so the close-in-macro reading is inference. The resolution is documentary (carrier
attestation, as-builts if any exist), not more tiles. See recommendation 2.
Section 9
Spectrum and 5G footprint
Footprint · low-band reliance
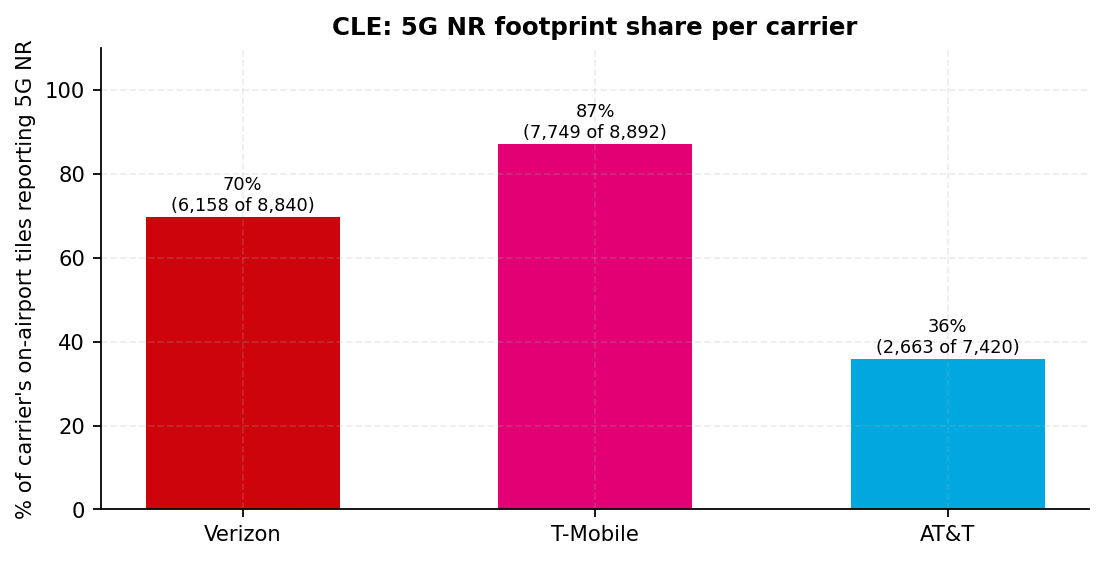
The 5G footprint is the share of a carrier's on-airport tiles that report a 5G NR (New Radio) reading.
T-Mobile 87% (7,749 of 8,892 tiles), Verizon
70% (6,158 of 8,840), AT&T 36% (2,663 of 7,420). The
remaining 64% of AT&T's tiles carry LTE only, which is why its LTE median at the gates (−96.8 dBm)
matters more than it does for the other two carriers.
Fig. 14 · 5G footprint · share of tiles with a 5G NR readingSource · Ookla
Footprint counts tiles with a non-null 5G reading. Window 2025-08-01 to 2026-07-31.
Low-band reliance
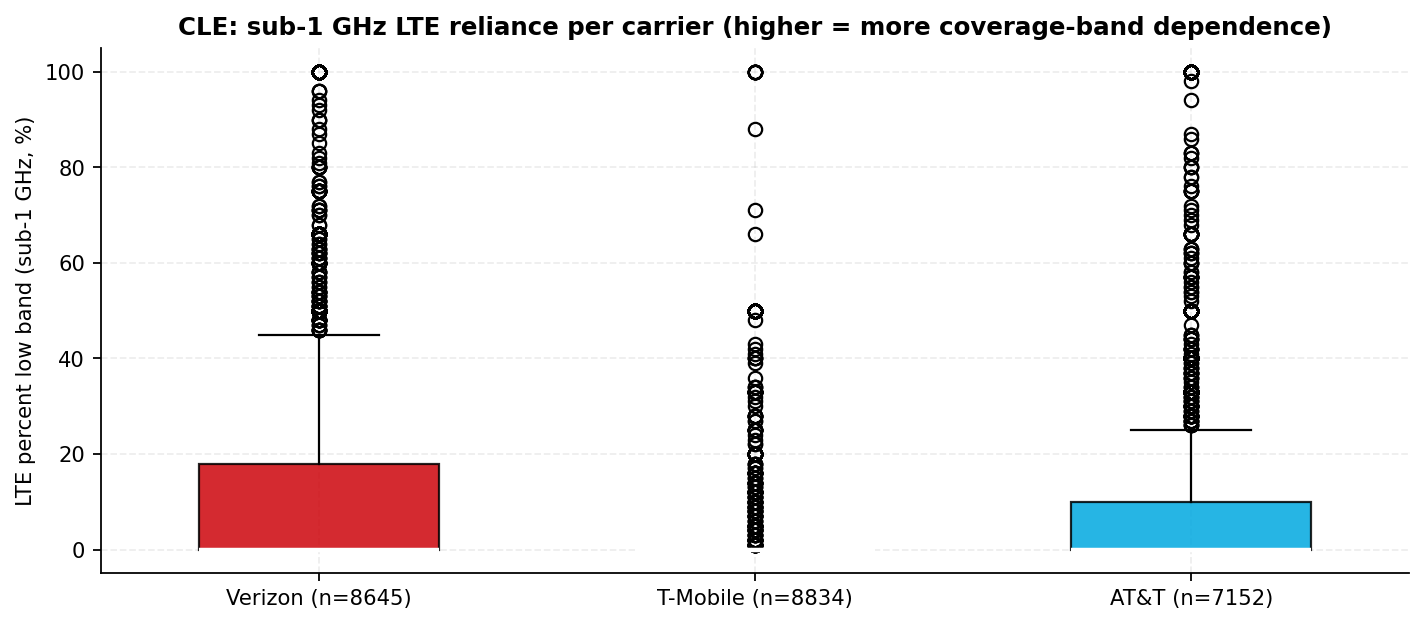
The percent-low-band statistic is the share of a tile's LTE observations on sub-1 GHz bands. A carrier
whose tiles lean on 600, 700, or 850 MHz spectrum is using coverage-grade bands where mid-band is
not reaching the tile reliably. T-Mobile's distribution sits near zero; Verizon and AT&T carry a
wider tail of low-band tiles.
Fig. 15 · LTE percent-low-band distribution per carrierSource · Ookla
n = tiles reporting the field: Verizon 8,645 · T-Mobile 8,834 · AT&T 7,152. Macro-site geometry is queued for the next revision.
Section 10
Load, density, and Wi-Fi offload
Venue and zone level only
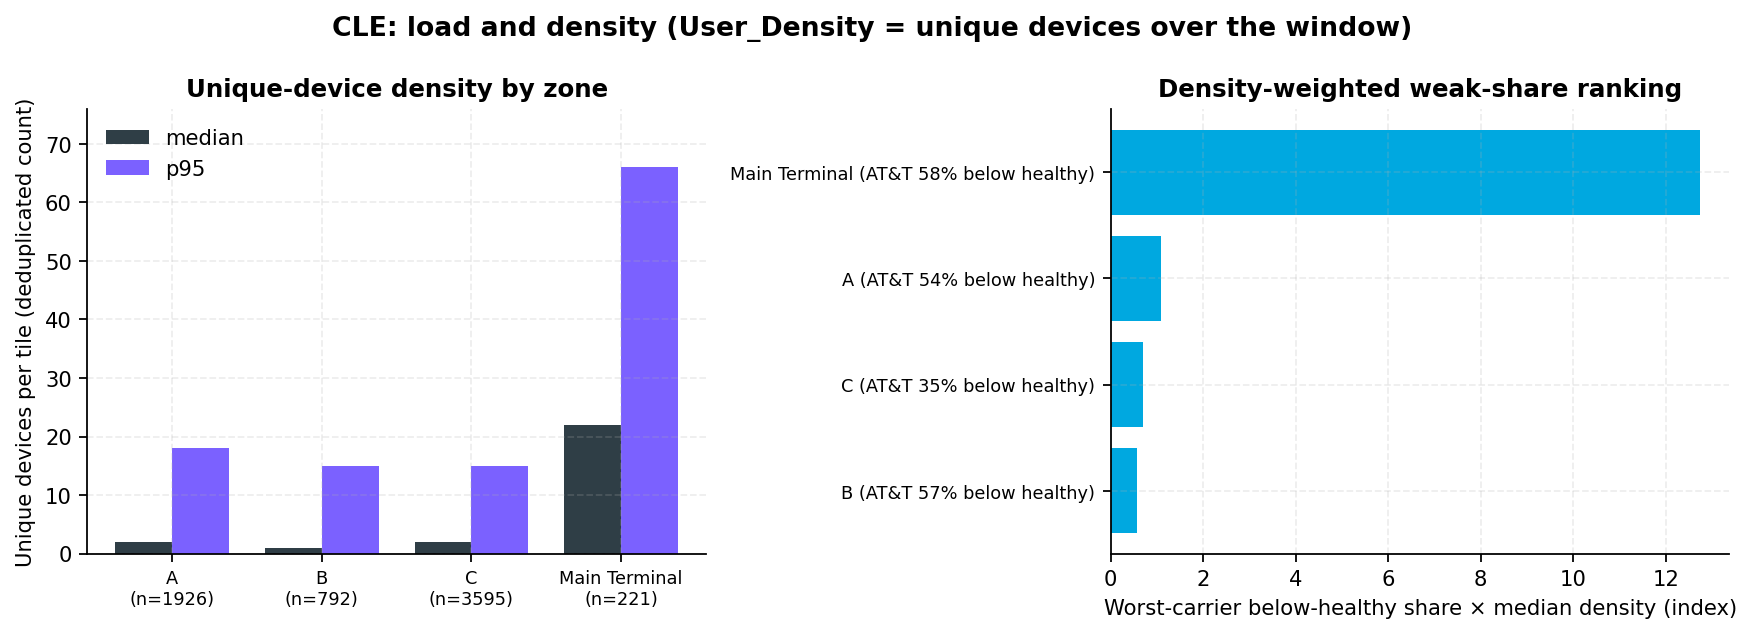
User_Density is Ookla's count of unique Android devices observed in a tile over the 12-month window,
deduplicated. It is a device count over the window and nothing else. Zone medians and 95th
percentiles (p95) locate where observed devices concentrate.
Zone
Median devices per tile
p95
Usage tiles (n)
AT&T below healthy
Density- weighted rank
Wi-Fi offload
Main Terminal
22
66
221
58%of tiles
1
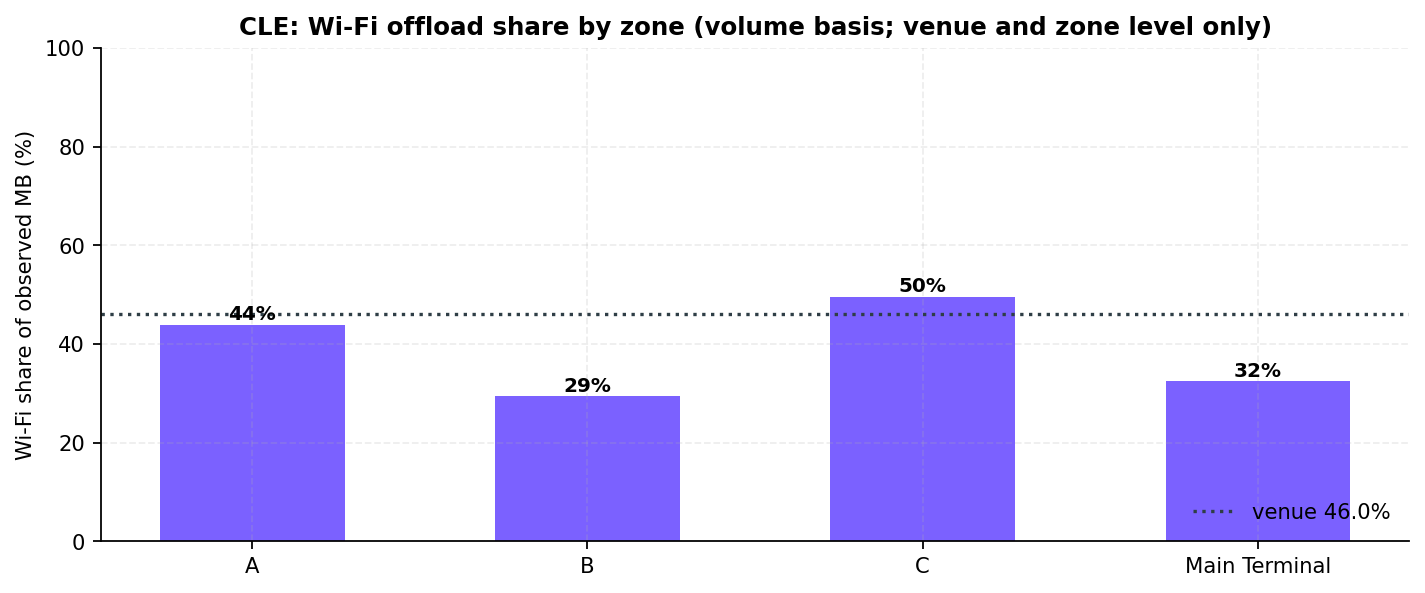
32%
Concourse A
2
18
1,926
54%
2
44%
Concourse C
2
15
3,595
35%
3
50%
Concourse B
1
15
792
57%
4
29%
Venue
2
17
14,065
n/a
n/a
46.0%
Density-weighted weak share = worst-carrier below-healthy tile share × median density. AT&T is the worst carrier in
4 of 4 zones. Offload = Σ Wi-Fi MB ÷ Σ (Wi-Fi + mobile) MB on the All Networks panel.
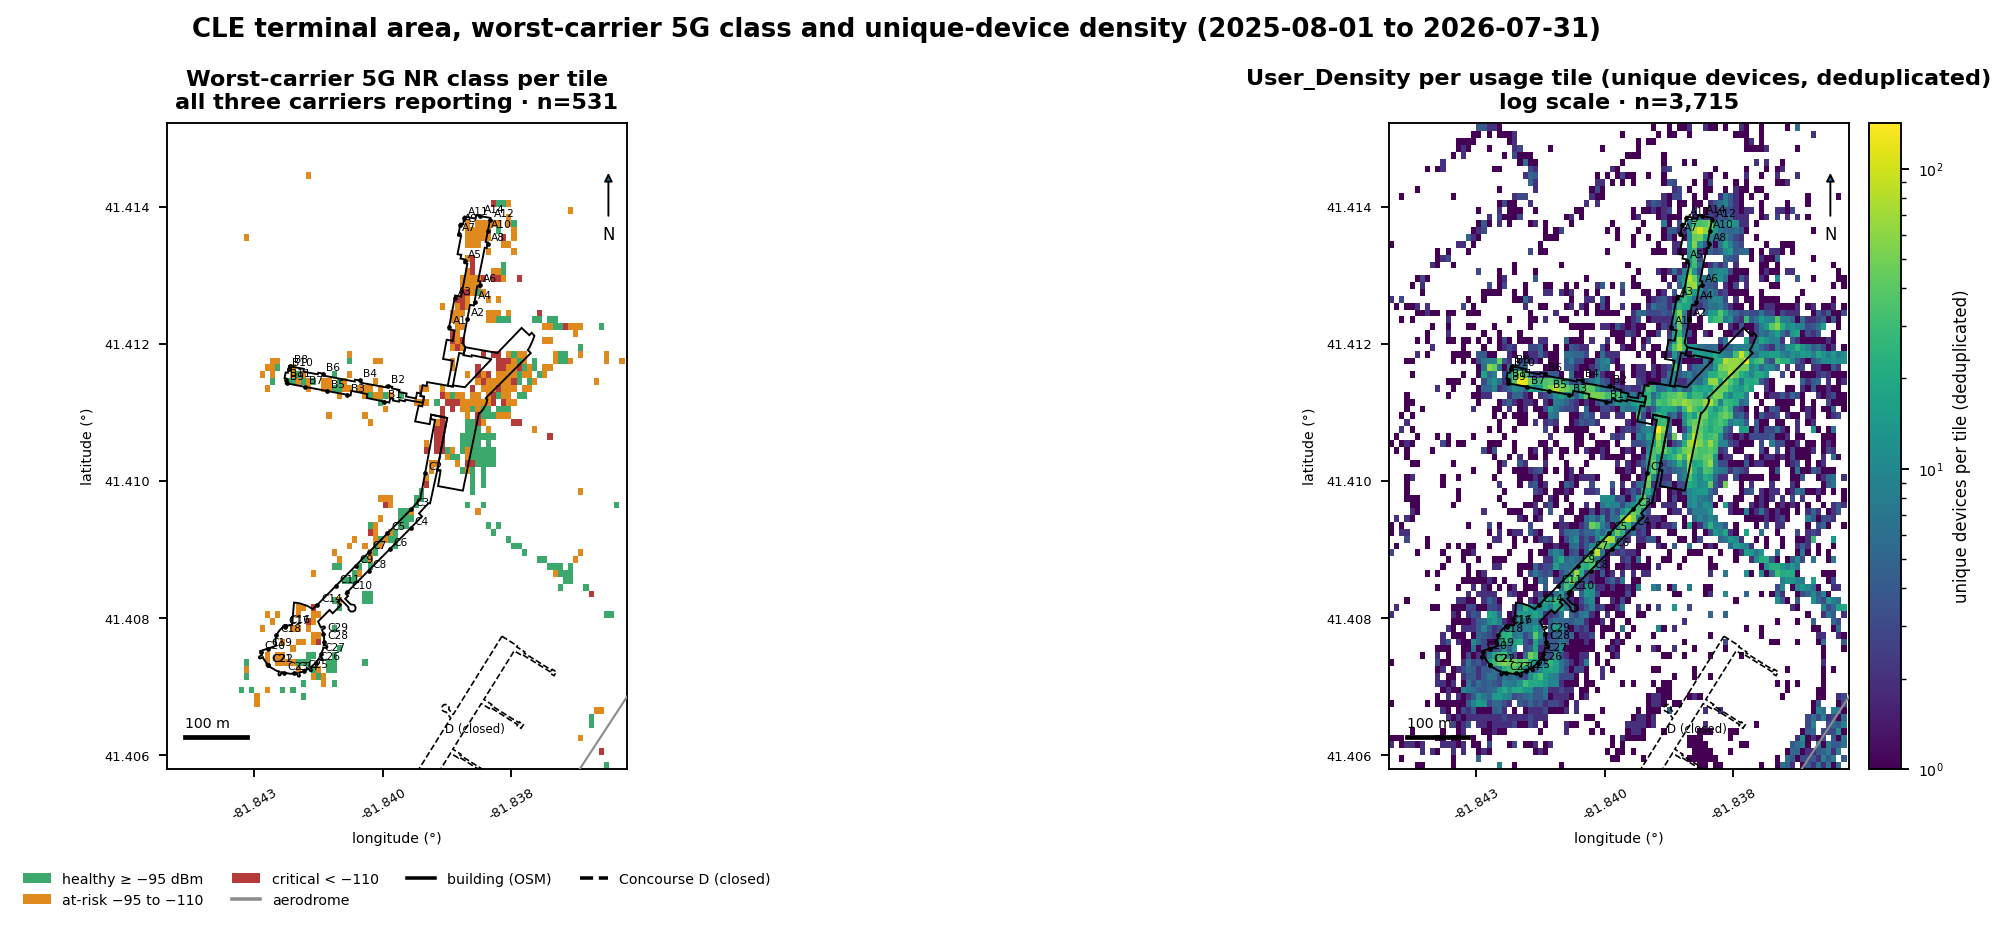
The Main Terminal ranks first: AT&T is below healthy on 58% of its tiles, and the zone's median density
is eleven times the highest concourse median. Concourse A ranks second on a similar weak share and a far
lower density.
Fig. 16 · Worst-carrier 5G class per tile and unique-device density per tileSource · Ookla
Left: worst-carrier 5G NR class per tile where all three carriers report (n=531). Right: User_Density per usage tile, unique devices over the window, deduplicated, log scale (n=3,715). Source: Ookla Cell Analytics. Window 2025-08-01 to 2026-07-31.
Fig. 17 · Unique-device density by zone · density-weighted weak-share rankingSource · Ookla
User_Density = unique devices over the window, deduplicated. Tile basis. Window 2025-08-01 to 2026-07-31.
Wi-Fi offload
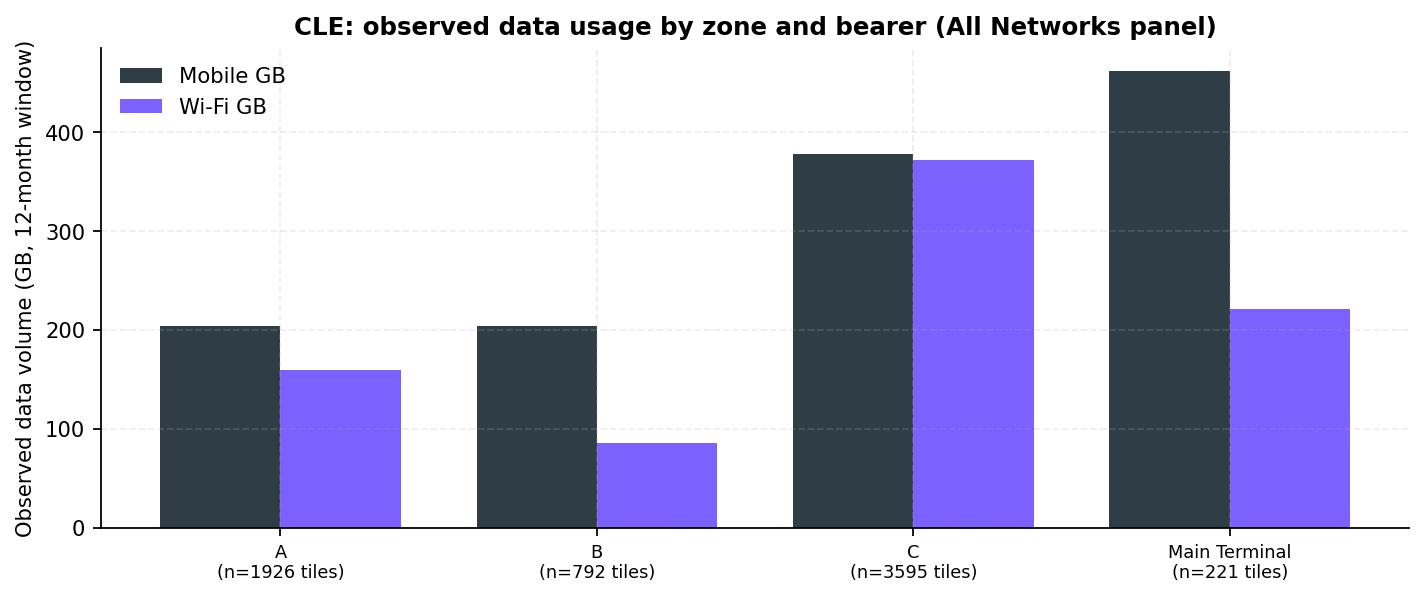
Venue-wide, 46.0% of observed data volume moves over Wi-Fi (n=14,065 usage tiles). Zone shares run
from 29% in Concourse B to 50% in Concourse C. Wi-Fi is present on 53% of the 10,518 tiles that
report the field.
Fig. 18 · Observed data volume by zone and bearerSource · Ookla
Fig. 19 · Wi-Fi share of observed data volume by zoneSource · Ookla
No per-carrier offload
Offload is computed at venue and zone level only. The export does not attribute Wi-Fi usage to any
cellular carrier's subscribers, so per-carrier offload is not derivable at any aggregation and is
never implied here. The figure blends CLE_Public_WiFi with tenant and personal networks and cannot
separate them. Absence of a Wi-Fi reading on a tile is absence of measurement.
Section 11
Carrier-asymmetry atlas
Worst-carrier tally per gate
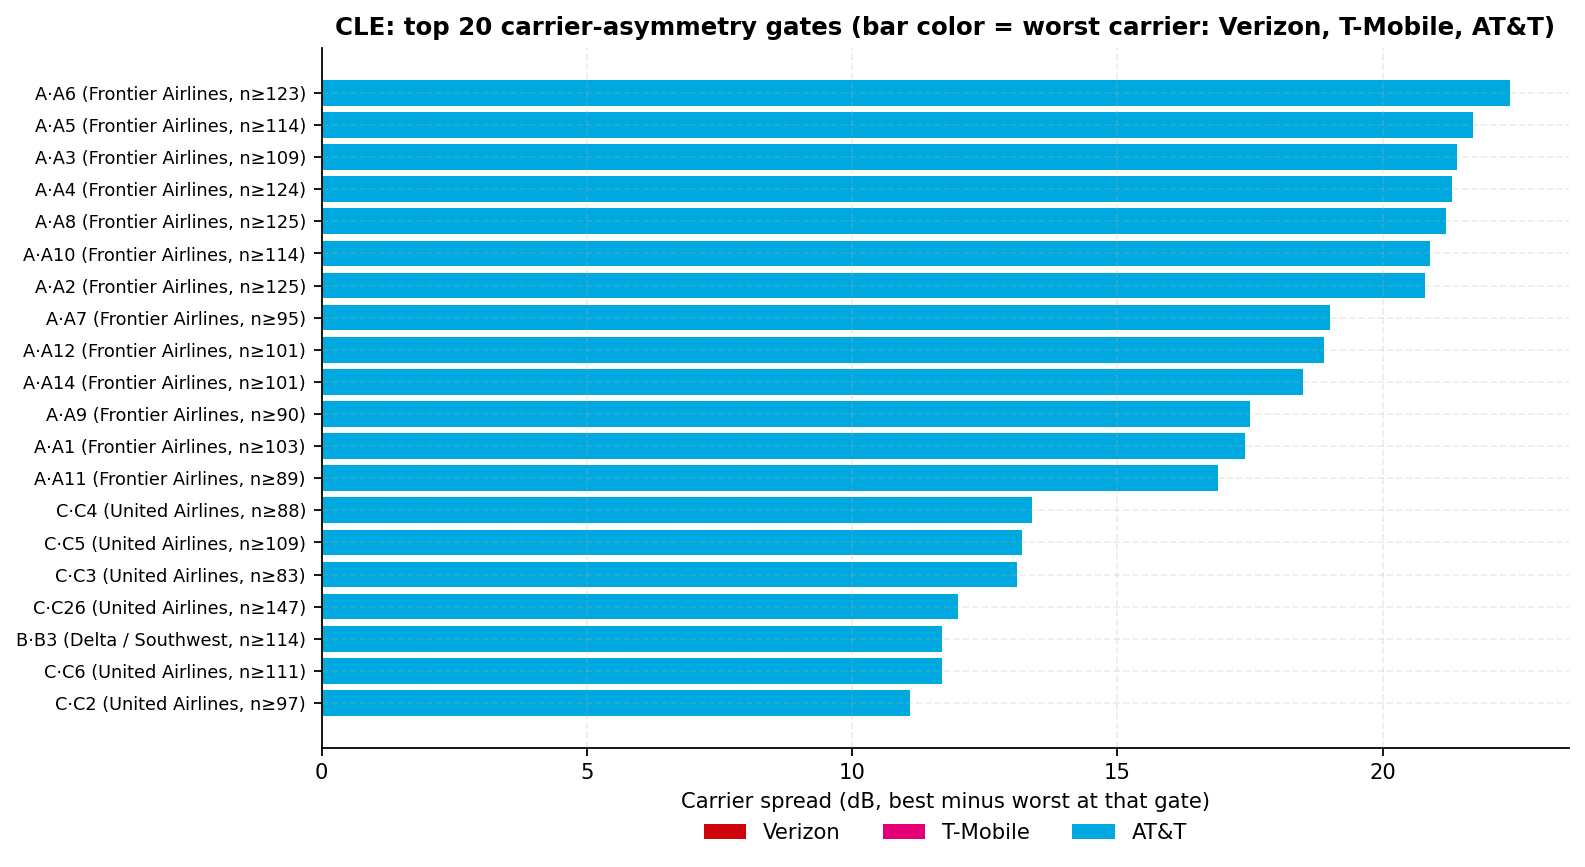
Per gate, the atlas names the weakest carrier and the spread from the strongest carrier's mean to the
weakest. AT&T is the worst carrier at 47 of 49 ranked gates; Verizon at 2. All 49 gates clear the
30-tile floor for every carrier, so none are excluded. The five largest spreads sit at Concourse A
gates and are the named compression targets in section 12.
Gate
Concourse · airline (Tier B)
Worst carrier
Spread
Min n per carrier
A6
A · Frontier
AT&T
22.4 dB
123
A5
A · Frontier
AT&T
21.7 dB
114
A3
A · Frontier
AT&T
21.4 dB
109
A4
A · Frontier
AT&T
21.3 dB
124
A8
A · Frontier
AT&T
21.2 dB
125
Fig. 20 · Carrier-asymmetry atlas · top 20 gates by spreadSource · Ookla
Spread = best minus worst carrier mean 5G RSRP at the gate. Every published pair n ≥ 30 tiles. Window 2025-08-01 to 2026-07-31.
Section 12
Recommendations and acceptance criteria
Ordered by leverage · each with an owner
Confirm the status of the 2024 neutral-host solicitation
No award appears in the record we hold. If the procurement proceeds, adopt this baseline as the
design input: the gate suite, the zone table, and the asymmetry atlas define what the system must
change.
Owner · Department of Port Control
Have each carrier attest its terminal coverage source
Verizon and T-Mobile show flat terminal-to-periphery deltas that the record cannot explain; AT&T
is slightly periphery-stronger, consistent with but not proof of macro spillover. Obtain each carrier's statement before any DAS design freezes, so an
unrecorded asset is not designed around or decommissioned unexamined.
Owner · Department of Port Control + Verizon, T-Mobile, AT&T
Name the first acceptance zones
AT&T in Concourses A and B (46% and 43% healthy tiles), Concourse C, and the Main Terminal
(density-weighted rank 1). These zones carry the largest measured lift for a hosted AT&T path.
Owner · Department of Port Control + neutral-host provider
Re-measure over a like-for-like window after go-live
Same instrument, same window length, same thresholds, for the before/after comparison. Use
per-carrier commissioning walk tests, not the crowdsource panel, as the acceptance test.
Obtain Wi-Fi controller telemetry to size the offload layer
Venue offload is 46.0% of observed volume and reaches 50% in Concourse C. The tile export
cannot separate CLE_Public_WiFi from tenant and personal networks; the controller can.
Owner · Department of Port Control IT
Decide the CBRS and private-wireless question alongside the DAS build
Decide it with the neutral-host design and the CLEvolution program, since retrofitting Citizens
Broadband Radio Service (CBRS) or operational spectrum into a commissioned system costs more than
designing it in.
Owner · Department of Port Control
Acceptance criteria
Criterion
Baseline (rev 1)
Target
AT&T healthy share, per zone
10 of 49 gates healthy · tiles: A 46%, B 43%, C 65%, Main Terminal 42%
Healthy at 90% or more of gates and tiles in each zone
Venue LTE gate median −97.4 dBm · healthy at 6 of 49 gates
Zone LTE medians in A and B raised to the −95 dBm healthy line
Gate-named criteria depend on the gate inventory; reconcile the OSM inventory (A 13, B 11, C 25) against the
airport's current gate plan before adoption.
Section 13
Methodology and audit trail
Thresholds · provenance · reproducibility
Rule
Value
Sample basis
Ookla Cell Analytics: crowdsourced background scans from consumer Android handsets, aggregated per tile over the 12-month window. Per-carrier RF exports plus one All Networks usage export.
Tile geometry
0.0001° × 0.0001° tiles, about 8 m by 11 m at CLE's latitude. The export holds no per-tile scan count, so every n counts tiles, not scans. No Z-axis.
Gate and tenant values: mean of tiles within 80 m of the point. Zone assignment: nearest labeled point within 500 m. Clip: KCLE aerodrome polygon plus 200 m.
Maps
Tile maps color each 0.0001° tile by the locked ladder. Building mask = point-in-polygon of tile centroids against the pinned OSM footprints; a disclosed proxy for the Ookla Indoor layer, which is queued.
Minimum n
No chart or comparative claim ships on fewer than 30 tiles or points; smaller cells are reported as counts with n visible, never ranked. Margins under 1 dB are ties.
Metric discipline
Signal-layer only: no throughput, latency, or session counts are in this export and none are claimed. User_Density is a deduplicated unique-device count over the window. Per-carrier Wi-Fi offload is not derivable and never implied.
Window and freshness
2025-08-01 to 2026-07-31 · issued 2026-09-08 · 39 days at issue, within the 90-day policy.
Sourcing
Measured facts reproduce from raw exports; transcribed facts carry capture dates; facts sourced from the Imagine knowledge graph are tagged inline as such.
Photographs
Tier B illustrative material from Wikimedia Commons under the listed licenses (CC BY-SA 4.0, resized only); credited on each image. Photographs are not measurements.
Tenant basis
82 mapped venue points: 70 Google Places + 12 OpenStreetMap, pinned 2026-09-08 (Tier B). Lounge points with carrier data: 2 (The Club CLE, United Club).
Every published measurement is independently recomputed from the raw pinned exports by
validate_cle_report.py: 39 checks PASS, 19 of 19 Tier-A claims covered. The audit dossier
(23-claim lane-tagged ledger, methodology, provenance manifest, findings log, agent-trace index) ships
with the verification bundle. A blind cold read by an independent reviewer was completed on 2026-09-08
and its dispositions are applied in this issue. reproduce.sh run twice: byte-identical
CHECKSUMS.sha256. Deliverable subject to the two-lane human review gate; sign-off status
accompanies this issue.